Related Blogs
January 20, 2022 | Avalon Team
One of the most important themes these days is the rotation between growth and value stocks.
To be clear, we’re not seeing a rotation out of stocks into risk-off alternatives, we’re seeing a rotation within the equity market.
Groups like Energy and Financials have been breaking to new highs while growth and Tech indexes have come under serious pressure (as you’ll see in our Relative Strength Analysis below).
We’re only 20 days into the new year, but so far 2022 is telling the story of two markets – and possibly foreshadowing what’s to come.
You see, while cyclical and value stocks look to become this year’s outperformers, it looks like the party is finally coming to an end for the growth trade.
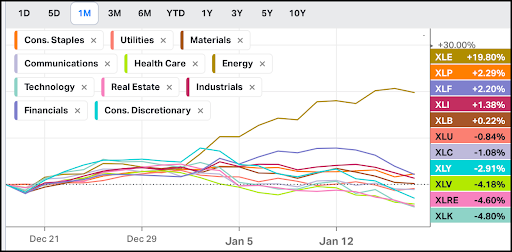
Here is a one-month chart of the 11 broad sectors of the U.S. market.

Take a look at the performance leaders: Energy, Staples, Financials, Industrials, and Basic Materials. In other words, value stocks.
Just as important, is what isn’t working… previous leaders like Technology, Consumer Discretionary, Communications – the growth stocks.
Further proof can be seen in our Relative Strength analysis of the broad sectors, as Financials and Energy hold the two top spots after displacing Technology (now #3). Industrials are close to breaking into the top four.
That would make three of the four strongest sectors cyclical value groups.
Energy stocks (XLE) have been on a torrid run. Beginning 2022 ranked #6 out of the 11 broad sectors we track, January 11 they were #4 and as of last night’s market close, Energy moved into the #2 ranked sector.
It’s also noteworthy that this is the first time in five years (2017) that Financials have been the top dog.
So, investors will want to lean into these value-heavy leadership groups in 2022. As for growth, well, as long as rates continue to rise, it’s likely to remain messy.
When we look beneath the surface at growth and value stocks right now, our breadth data is confirming what we’re seeing at the sector level.
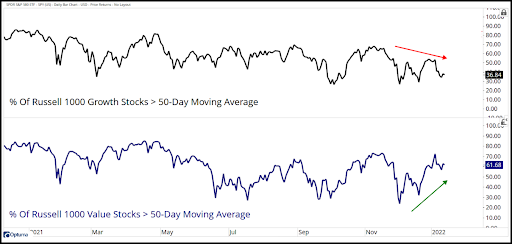
Here’s one way to visualize how large-cap value and large-cap growth are moving in opposing directions.
This indicator shows us the percentage of stocks above their 50-day moving averages for each of these indexes:

Breadth or participation from large-cap value stocks has risen dramatically since December. The metric went from 20% to 70% in just over a month.
Large-cap growth looks very different. We’ve seen the number of stocks above their 50-day moving average fall from about 70 to under 40 in recent months.
I think Investors have two options – complain that growth stocks can’t seem to find a floor or rotate into the groups that are working. Don’t overcomplicate it.
For now, our breadth analysis is confirming the price action at the sector level. While nothing looks good in the growth space, it’s all bullish for energy and financials.
One thing we’re keeping a close eye on is for participation to broaden out to the other value sectors like Materials and Industrials.
It’s not quite there yet, and we want to see these areas participate and help confirm the value trend.
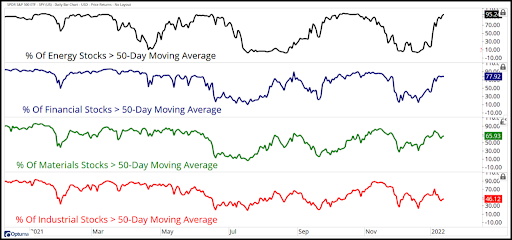
Here’s a look at the percentage of stocks above their 50-day moving averages for each of the value sectors.

Energy has an impressive 95% of stocks above their 50-day moving average, closely followed by Financials at 77%.
Before we can bet on a sustained rotation into value stocks, we want to see participation broaden to these sectors as well. Financials and Energy can’t prop up the entire market.
For now, we like the idea of leaning on leadership (Financials and Energy).
When it comes to the health of the overall market, we want to see an improvement in market internals from Industrials and Materials.
These groups following Energy and Financials to new highs would be a very bullish development. We’ll be keeping a close eye on them for confirmation.
If you have any questions or have been considering hiring an advisor, then schedule a free consultation with one of our advisors today. There’s no risk or obligation—let's just talk.
Tags

Free Guide: How to Find the Best Advisor for You
Get our absolutely free guide that covers different types of advisory services you'll encounter, differences between RIAs and broker-dealers, questions you’ll want to ask when interviewing advisors, and data any good financial advisor should know about you and your portfolio.

