
Related Blogs
June 6, 2023 | Avalon Team
Side-impact collisions are a dangerous type of motor vehicle accident where two vehicles collide on their sides.
When it comes to market collisions, size-on-market corrections can be worse.
What is a size-on-market collision?
Well, it’s less of a technical finance term, but it accurately defines the risks unsuspecting investors have now.
Consider this – according to NDR Research, the seven largest companies now have a market cap bigger than the Energy, Materials, Industrial, and Financial sectors combined.
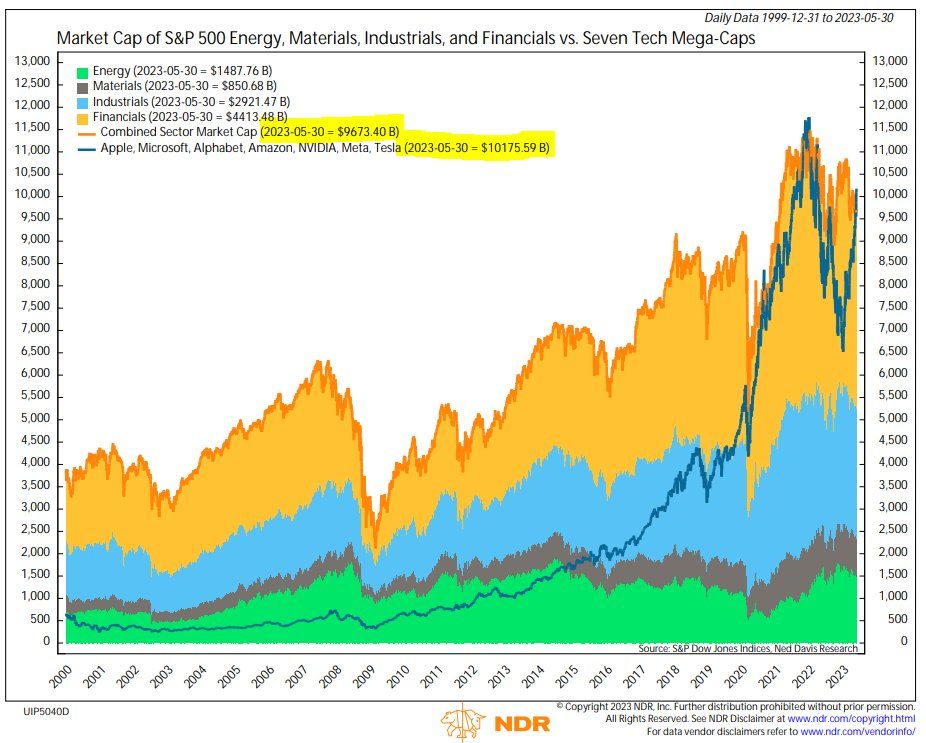
The last time that there was that much wealth concentrated in so few names was in 2000 when the top ten stocks made up 46% of the S&P 500.
Today, the current value of FAAMG (Facebook, Amazon, Apple, Microsoft & Google) + Telsa + Nvidia stands at 54.5%.
Here is why this is so important for investors to understand.
An unsuspecting investor might believe they have a “diversified” portfolio because they are investing in an index fund. But if nearly 55 cents of every dollar is buying just seven stocks, how diversified is it, really?
With these seven stocks mainly driving up 83% of 2023 returns for US tech stocks the natural reaction by investors is to chase these big names, but what does history tell us?
Historically speaking, giant companies’ stocks underperform more as time goes on.
Dimensional Fund Advisors did a study and analyzed the performance of US stocks that entered into the top 10 by market capitalization and how they performed afterward.
The data showed the average OUTPERFORMANCE against US markets:
- 10 years BEFORE entering Top 10: +10.0%
- 5 years BEFORE entering Top 10: +19.3%
- 3 years BEFORE entering Top 10: +24.3%
- 3 years AFTER entering Top 10: +0.7%
- 5 years AFTER entering Top 10: -1.1%
- 10 years AFTER entering Top 10: -1.3%
What the historical data tells us is:
Before: Rapid growth far EXCEEDING the market average until they become a top 10 company.
After: Muted returns that are in line and slightly below the market average.
So be careful about chasing stock giants – and be careful of the hidden danger within index funds.
The rally in US technology stocks this year, and in particular AI-related stocks, has pushed US stock valuations to their HIGHEST level since July 2022.
Among sectors, semiconductors have been the strongest. Valuations-wise, the global semiconductor industry has reached the HIGHEST levels since early 2010, as growth expectations for semiconductors pushed by trends such as AI, electric vehicles, and data centers have fever levels.
If we look at what the current stock valuation means for future returns based on past patterns, we can see the expected 10-year annualized real rate return is between -3% to +3%, suggesting SIGNIFICANT DOWNSIDE RISKS relative to the long-term average of +5% return.
For investors, the message is clear.
The built-in concentration risk of products being benchmarked to popular cap-weighted indices suggests a combined headwind of slowing growth and potential multiple contractions.
The result will be returns that will be much less than expected by many investors.
For investors who want a trip down memory lane, here are the companies that have owned the spotlight over time.
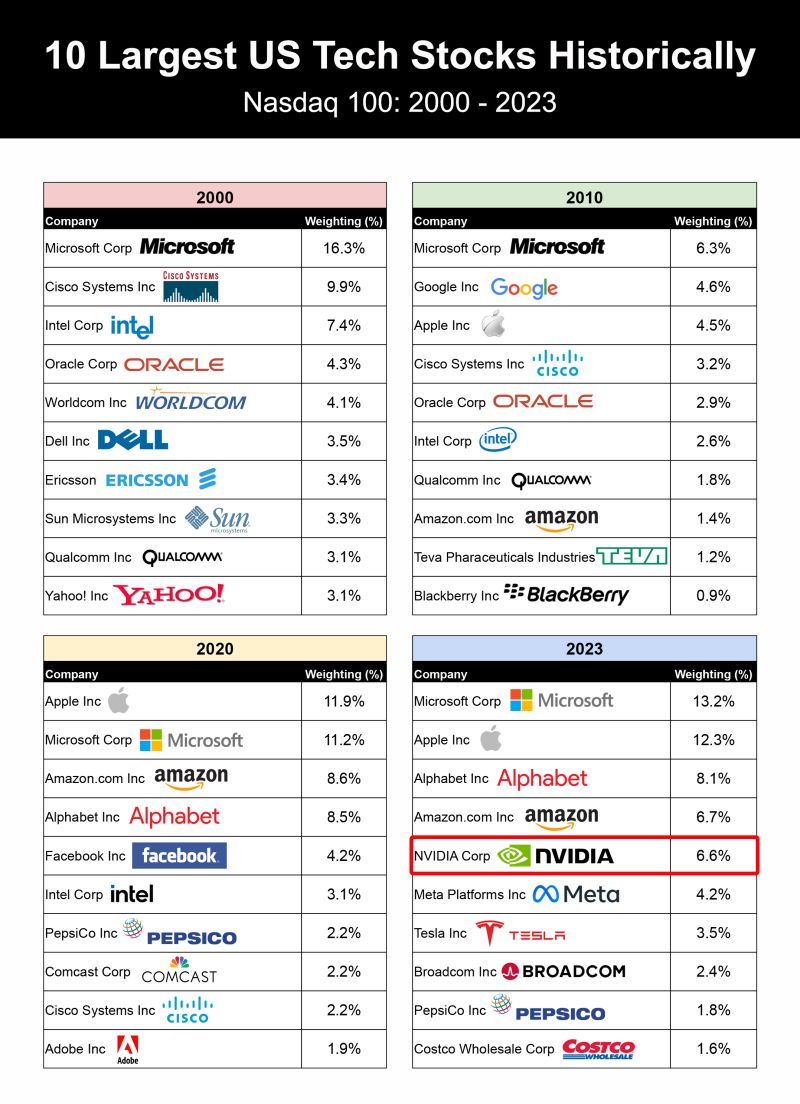
It’s worth noting that past winners have included companies that no longer exist, so be careful with what you assume…
It smells like 2000 all over again.
If you have any questions or have been considering hiring an advisor, then schedule a free consultation with one of our advisors today. There’s no risk or obligation—let's just talk.
Tags

Free Guide: How to Find the Best Advisor for You
Get our absolutely free guide that covers different types of advisory services you'll encounter, differences between RIAs and broker-dealers, questions you’ll want to ask when interviewing advisors, and data any good financial advisor should know about you and your portfolio.
