
Related Blogs
December 21, 2021 | Michael Reilly
There’s one ratio chart you don’t want to miss right now.
It’s one to focus on over the coming days and weeks ahead.
I’ve been saying this most of the year.
Don’t be fooled by what you think you see out of the cap-weighted S&P 500 index…
Most stocks are either grinding sideways or have recently failed at attempted breakouts.
The bulls can’t get it done.
Just look at the Small-Cap Stock Index.
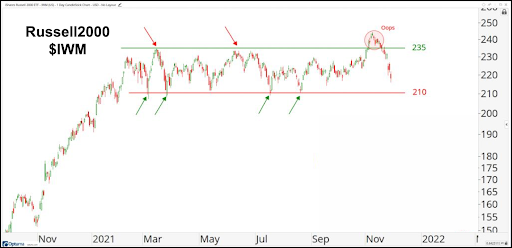
After spending most of 2021 range-bound, small-caps finally broke out in late November, only to fail miserably in December.
And as the saying goes, “from failed moves, come fast moves in the other direction.”
But you didn’t need my help to see what happened with small-caps. So let’s dig deeper than what most investors can see on their own…
I’m going to give you a seat next to some of the world’s biggest mutual fund managers so you can see what they’re doing with their money right now.
All we have to do is look at what may be one of the most important Relative Strength ratio charts we’re monitoring today…
This ratio chart compares the strength of Consumer Discretionary (growth) stocks versus Consumer Staples (defensive) stocks.
Why is this chart you need to pay attention to?
Most mutual funds are mandated to stay fully invested. So, unlike individual investors, mutual funds can’t rush to the safety of cash if they’re worried about the current state of the market.
Mutual fund managers (the long-only community) only have two basic choices: Risk-On or Risk-Off.
Invest in growth stocks, which they’ll do when the economy supports growth – or invest in defensive stocks, which they’ll do when they’re worried the economy and stock markets are weak in the knees.
So by looking at this one ratio chart, investors, just like you, can see what some of the biggest fund managers in the business are thinking as they decide which direction to go, Risk-On or Risk-Off.
But before we take a peek, here are a few things you need to know:
- Consumer Discretionary stocks include things like Autos, Retail, and Home Builders. These are all areas where consumers go to spend their discretionary income.
- When Consumer Discretionary stocks are charging higher, this is normally happening in an environment of economic growth, so investors are willing to take on the additional risks associated with investing in growth stocks.
- Consumer Staples stocks are things consumers will spend money on regardless of economic conditions. You’re still going to wash your clothes, brush your teeth, and eat and drink. Think of toothpaste, laundry detergent, food, and beer as staples…
- When Consumer Staples is leading, it’s often a sign of economic weakness and Risk-Off behavior. It’s a sign people are tightening the proverbial belt on spending.
So which group is in charge today? Check the chart.
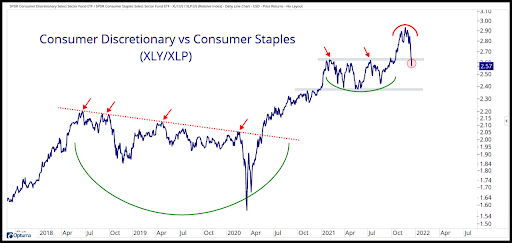
When the line in the ratio chart is rising, Consumer Discretionary stocks are outperforming staples. It’s Growth Stocks over Defensive Stocks.
And that’s a bullish signal for growth investors.
But see how the line peaked in October and November? Since peaking, the relationship moved sharply lower as Consumer Staples is outperforming discretionaries.
This means Risk-Off and defensive positioning by big investors.
But that doesn’t mean panic. Consumer Staples are still stocks.
We expect them to participate and rise in price during bull markets. But what we don’t want to see is Staples outperforming Discretionaries for any significant length of time.
And it’s starting to look like that’s what’s happening.
It’s still too early to call it over for Consumer Discretionaries or this bull market, but there are definitely signs of weakness you should be aware of.
This market is messy, it’s been messy since February. It’s range-bound – again.
Investors are going to have to be both patient and nimble until we get a definitive directional bias from market internals.
The Consumer Discretionary/Consumer Staples ratio chart is one of my favorites.
And right now it’s indicating investors should proceed with caution.
We’ll continue to pay close attention to the XLY/XLP ratio, looking for any hint of the direction of risk assets as we move into the last weeks of 2021.
If you’d like to talk a little more about how we can help you know what to expect no matter how the market is turning as we enter the next year, give us a call. You can schedule a free 1-hour consultation to review your portfolio and determine your risk score.
And as always, until next week, invest wisely, friends…
And Happy Holidays from all of us here at Rowe Wealth!

Tags

Get Our FREE Guide
How to Find the Best Advisor for You
Learn how to choose an advisor that has your best interests in mind. You'll also be subscribed to ADAPT, Avalon’s free newsletter with updates on our strongest performing investment models and market insights from a responsible money management perspective.
