
Related Blogs
October 5, 2020 | Michael Reilly
 Last Friday morning’s news that President Trump and the First Lady had tested positive for the coronavirus spooked markets, sending stocks to a sharply lower open.
Hours later, rumor of a possible new round of fiscal stimulus checks helped stocks make back some of the day’s earlier losses.
By the end of the day, however, all three major stock indexes ended the day lower.
Friday’s news was all about “external markets” – the DOW, the S&P 500 and the NASDAQ. And to no surprise, the day’s events gave “experts” a reason to weigh in and prognosticate about all the reasons “markets” did what they did.
Here’s the problem with that, it’s a waste of time. The market indexes are skewed, weighted to the largest stocks – feeding investors false information about the real health and direction of the overall market. And if that’s not enough, the indexes are a lagging indicator and therefore not very useful to most investors.
We have a market of stocks, not a stock market. Therefore, what investors need to know is how many stocks are participating in a given move? Who’s in control of the market – buyers or sellers? And are markets overbought or oversold? That’s useful information!
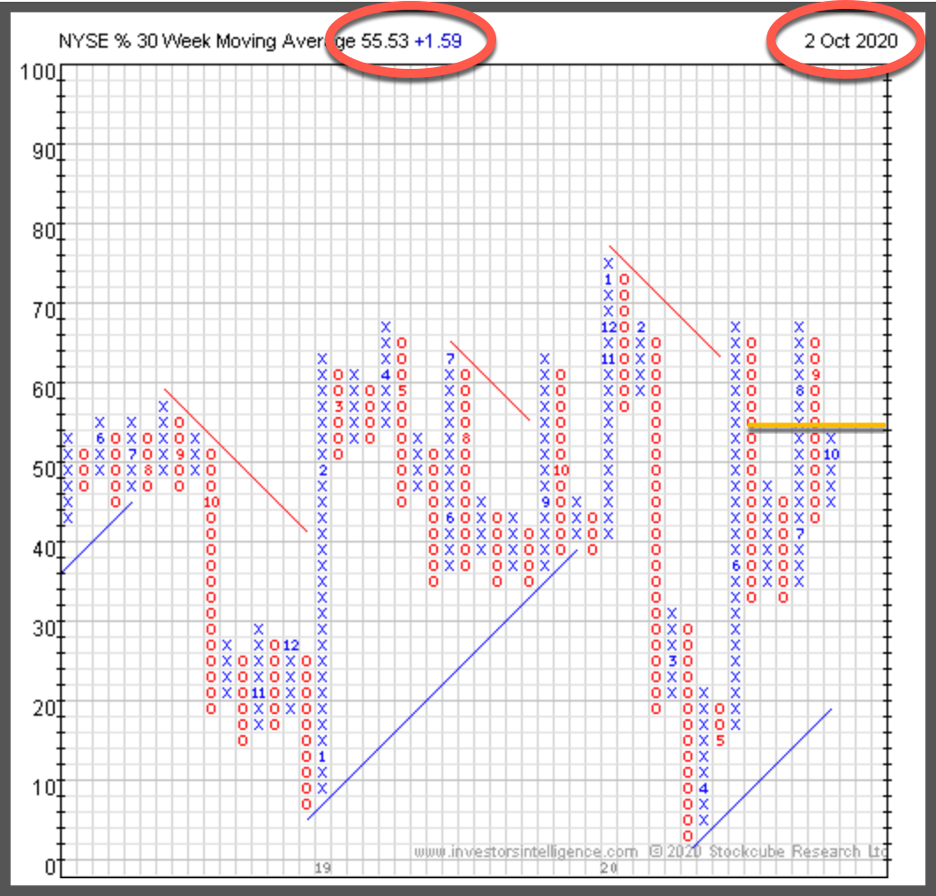
In last week’s ADAPT, I used our primary risk and participation barometer – the NYSE Bullish Percent Index (BPI) – considered an “internal market indicator” to assess the current status of U.S. markets.
I told investors, “The last few weeks, Mr. Market has been on its heels as sellers overwhelmed buyers, putting supply in control of the market”. (Click here to view the article from last week.)
I shared the image below of the NYSE BPI and explained that sellers remained in control of the market.
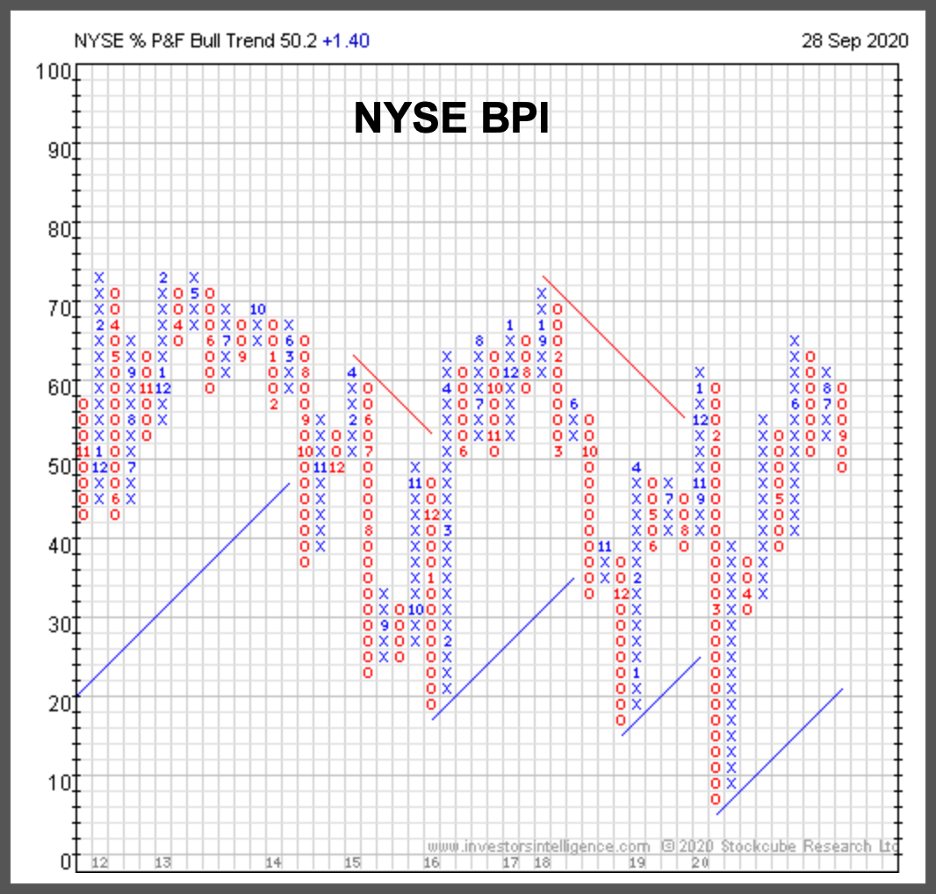
The column of “O’s” to the far right is indicating supply remains in control, with half the stocks trading on the exchange in an uptrend and 50% trading in a down trend.
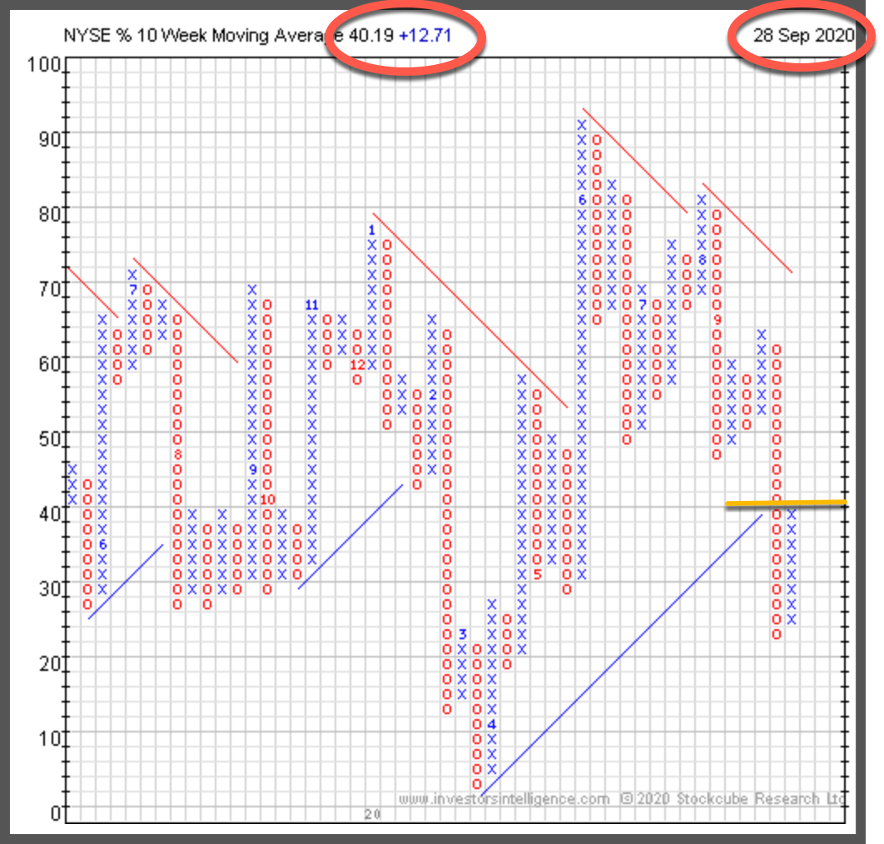
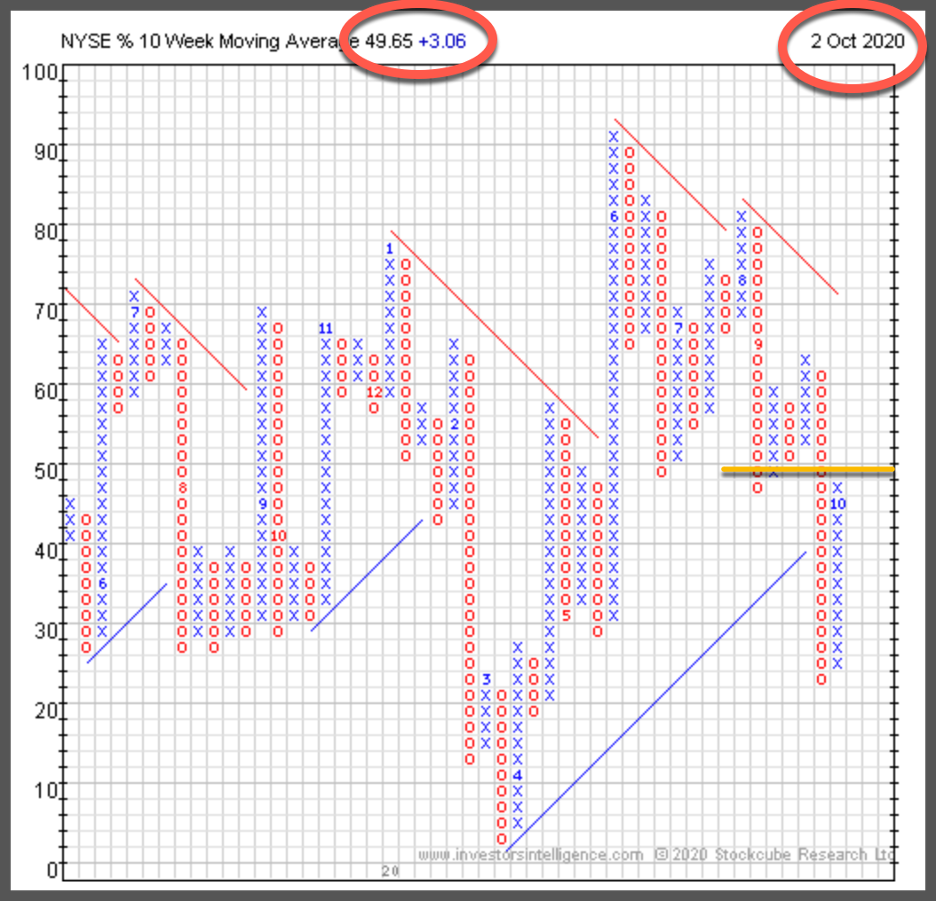
I also pointed to the fact that other, shorter and intermediate term market barometers, the %10 week (50 day) and %30 week (150 day) had both flipped positive, indicating demand finding a foothold and offering a possible tradable bottom.
So far, it looks like we are seeing some follow through from the levels we saw last week.
Short-term : %10 Week:
As of September 28, 2020, 40.19% of stocks trading on the NYSE were trading above their 50 day moving average.
As of October 2, 2020, the percentage of stocks, showing demand had risen to 49.65%. Nearly a 10% increase from the prior reading.
Intermediate-term: %30 Week.
Last week the %30 Week (150 day) was at 51.23% of stocks trading above their respective 150 day moving average.
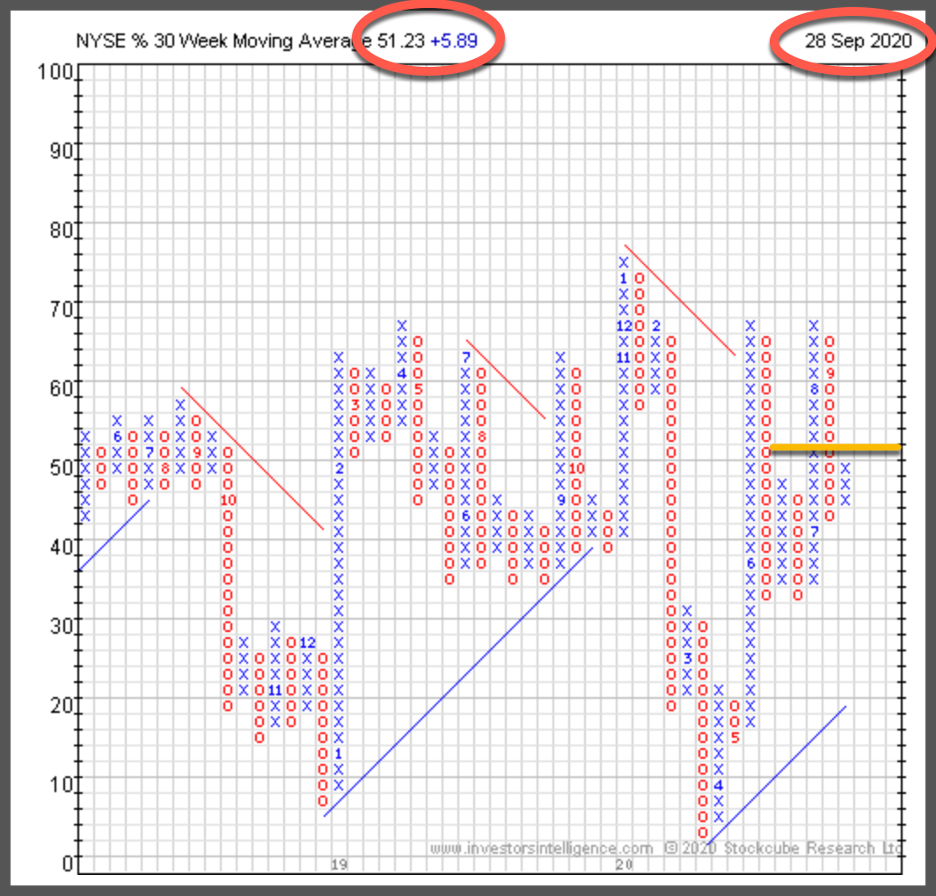
As we open Monday’s trading, the %30 week has improved to 55.53% of stocks trading above their 150 day moving average, meaning an additional 4% of all stocks trading on the NYSE moving higher above this key marker.
Fast forward to Sunday evening and our thesis continues to gain strength, as 14 of the 41 U.S. sectors that we track now show demand in control – that is in sharp contrast to a week ago, when only 2 of 41 sectors had demand (buyers) in control.
The chart below illustrates ETF performance vs. The S&P 500 index over the previous 10 days. All but one of the sector ETFs has outperformed the overall market.
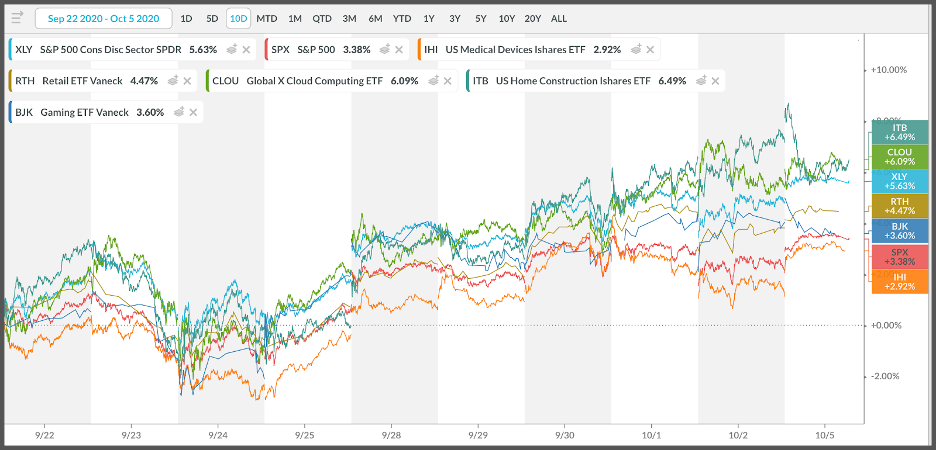
The 14 sectors showing institutional interest include Retail stocks, Autos and Auto Parts, Building, Gaming, Leisure and Restaurants.
And all these sectors have something in common. They’re all part of the broader Consumer Discretionary Sector.
Why is that an important observation? Because if the world is coming to an end, these sectors are more likely to sell off, not see higher prices.
Software and Semiconductors from the Technology sector are joining the party. As are, Healthcare related stocks – Medical devices and equipment.
And what can we say about these sectors? They’re not defensive! These are sectors that get bid up in an environment where stocks are expected to rise, not fall.
We saw something very similar after February’s market crash – more and more sectors quietly reversing higher as institutional demand (buying) for stocks took hold. It’s how we knew big institutions were buyers of stocks, long before it was visible to anyone focusing on the external market indexes.
Since we don’t have the ability to predict the future, the best we can hope to do is use whatever information is available, to access the strength and direction of the markets and then ADAPT accordingly…
That’s our approach to market analysis here at RWM. And I recommend it becomes part of yours as well.
So until next week, invest wisely.
Tags

Get Our FREE Guide
How to Find the Best Advisor for You
Learn how to choose an advisor that has your best interests in mind. You'll also be subscribed to ADAPT, Avalon’s free newsletter with updates on our strongest performing investment models and market insights from a responsible money management perspective.
