
Related Blogs
October 12, 2020 | Michael Reilly
 “Octoberphobia”… the term used to describe the phenomenon of major market drops occurring during the month of October.
October’s a month that often evokes fear on Wall Street, as memories are stirred of crashes like that in 1929, the rout in 1987 or the 554-point drop on October 27, 1997.
It was the week ending October 10, 2008, that saw the Dow lose 1,874.19 points, an 18.2% decline, which, according to Stock Trader’s Almanac, is the worst weekly decline in percentage terms, going all the way back to 1901.
So, are markets set up for yet another historic drop?
Not necessarily. You see, October also has an alter ego, because October has become a turnaround month— A.K.A, a “bear killer”.
Twelve post-WWII bear markets have ended in October: 1946, 1957, 1960, 1962, 1966, 1974, 1987, 1990, 1998, 2001, 2002 and 2011, when the S&P 500 declined 19.4%.
Here’s what the market internals are telling us about the following….
- New York Stock Exchange
- Dow Jones Industrial Average
- Mid-Caps
- S&P 500
- Nasdaq
- Nasdaq 100
- S&P 100
As of Friday, the Advance/Decline lines of all these indexes hit new all-time highs. New all-time highs are not evidence that stocks are going down! That, my friends, is a sign of continued and greater participation – the essence of a Bull market.
Here is an image of the A/D Line for the NYSE and the DIJA.
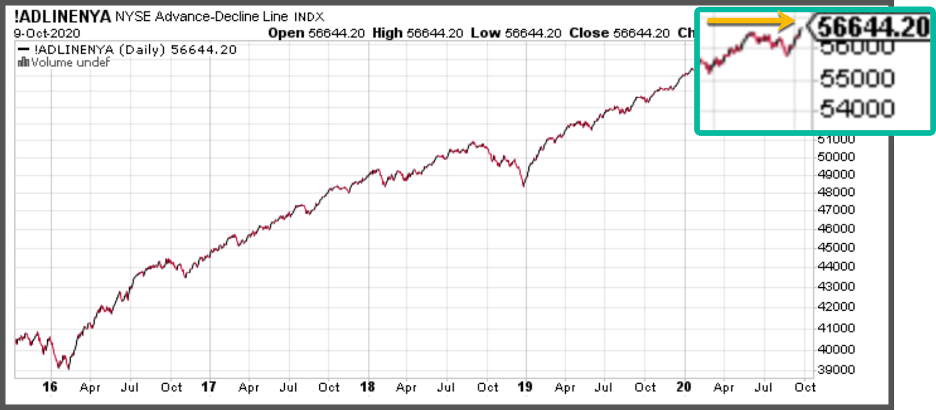
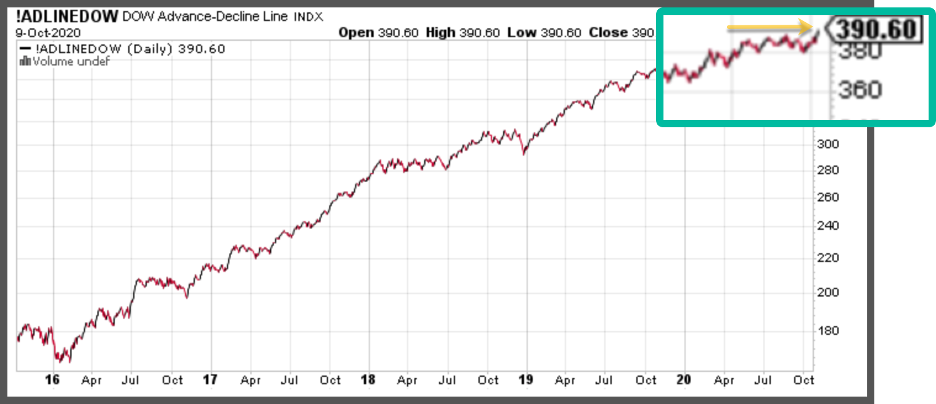
When we see chart’s moving from lower left to the upper right, it’s usually a good sign!
For those unfamiliar with the Advance/Decline, here is how Investopedia defines it:
“The A/D line plots the difference between the number of advancing and declining stocks on a daily basis. The indicator is cumulative, with a positive number being added to the prior number – or, if the number is negative, subtracted from the prior number.
The A/D line is used to show market sentiment, telling traders whether there are more stocks rising or falling. It’s used to confirm price trends in major indexes, and can also warn of reversals when divergence occurs” –
Here’s what I say about new all-time highs across the Advance/Decline lines of seven indexes- it’s not a reason to short stocks! – It’s yet another reason to own stocks.
Technicians tend to operate in a weight of the evidence world. And right now, until something changes, the weight of the evidence is clearly tilted in favor of owning stocks.
Until next week, invest wisely.
Tags

Get Our FREE Guide
How to Find the Best Advisor for You
Learn how to choose an advisor that has your best interests in mind. You'll also be subscribed to ADAPT, Avalon’s free newsletter with updates on our strongest performing investment models and market insights from a responsible money management perspective.
