
Related Blogs
January 4, 2023 | Avalon Team
2022 is officially in the books and many investors would say good riddance!
Using the benchmark indexes as our “market” proxies, it was pretty ugly.
But indexes can be misleading.
The DJIA ended the year down -7.67%, which, given all the noise last year, really isn’t awful.
The S&P on the other hand, fell -20.28%, the Russell small-cap growth index lost -21.16%, and the Tech heavy Nasdaq dropped by -33.55%.

As bad as that looks and feels to many investors, even in bear markets, there’s often something working.
So while money has continued to rotate out of the growth sectors such as Communications, Technology, and Consumer Discretionaries, it has found a new home in places like Industrials.
Take a look at this Relative Strength ratio chart comparing Industrials (XLI) to the broader S&P 500 index.
These are the kind of relationships we track around here on an ongoing basis – it’s part of our process for identifying both strengths and weaknesses.
Something I find interesting is that Industrials are the most correlated sector to the S&P because it is such a diverse sector.
So it would be natural to assume Industrials would generally move in tandem with the broader market (S&P 500), but that’s not always the case. Industrials have been an outperformer for months.
The fact that Industrials show such clear strength vs. the S&P either indicates how weak the broader market is (because of its high representation of Technology and Communications) or it points to overwhelming strength out of the Industrial sector.
So which is it? Perhaps both.
Looking at our Relative Strength chart comparing the price movements between the XLI and the S&P 500, we want to know if Industrials have been showing any meaningful outperformance relative to the broad market.
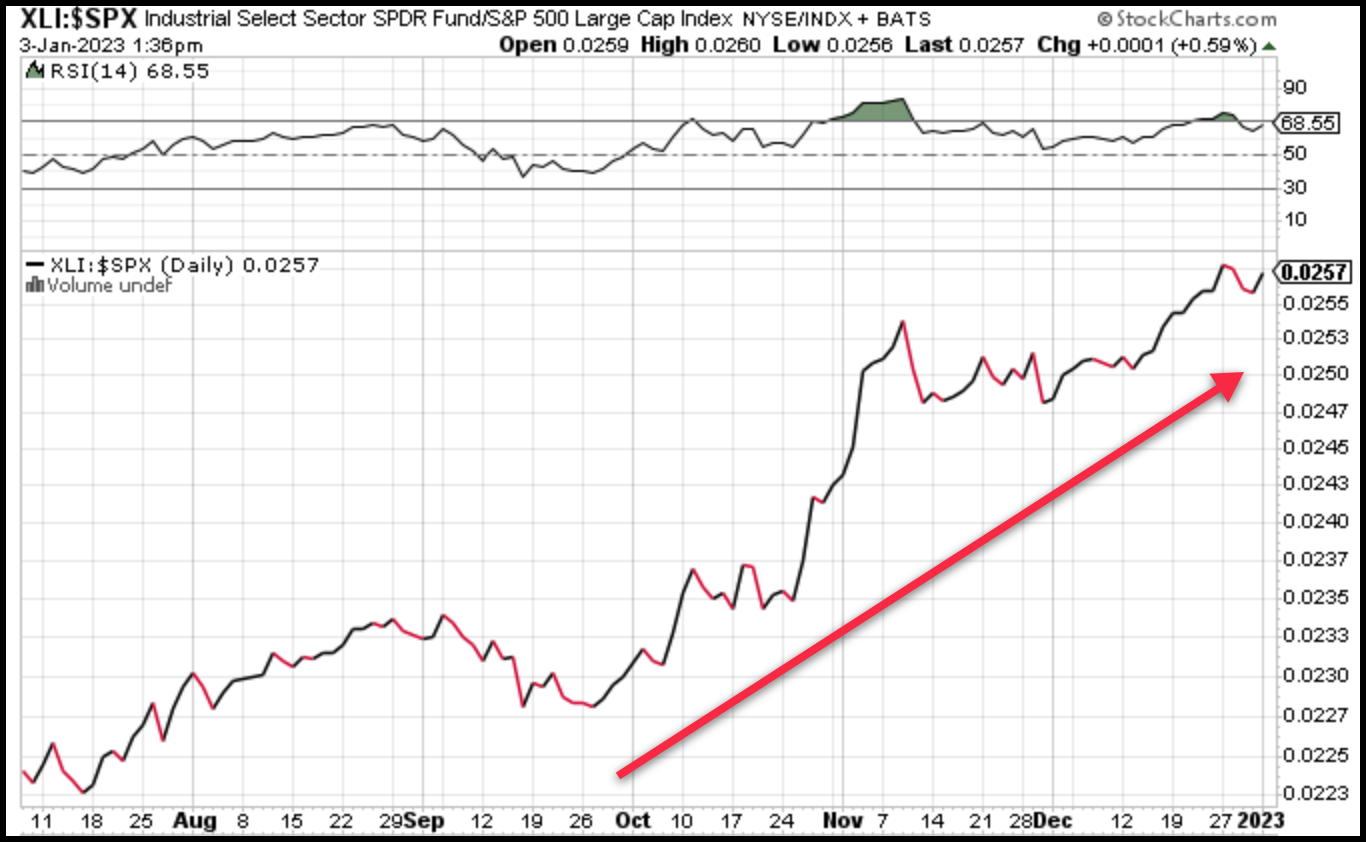
The rising line favors Industrials over the S&P 500. Had the line been falling, it would illustrate the broader S&P 500 index was showing strength vs. Industrials.
As the saying goes, “Where we see Relative Strength, we expect to see absolute performance.”
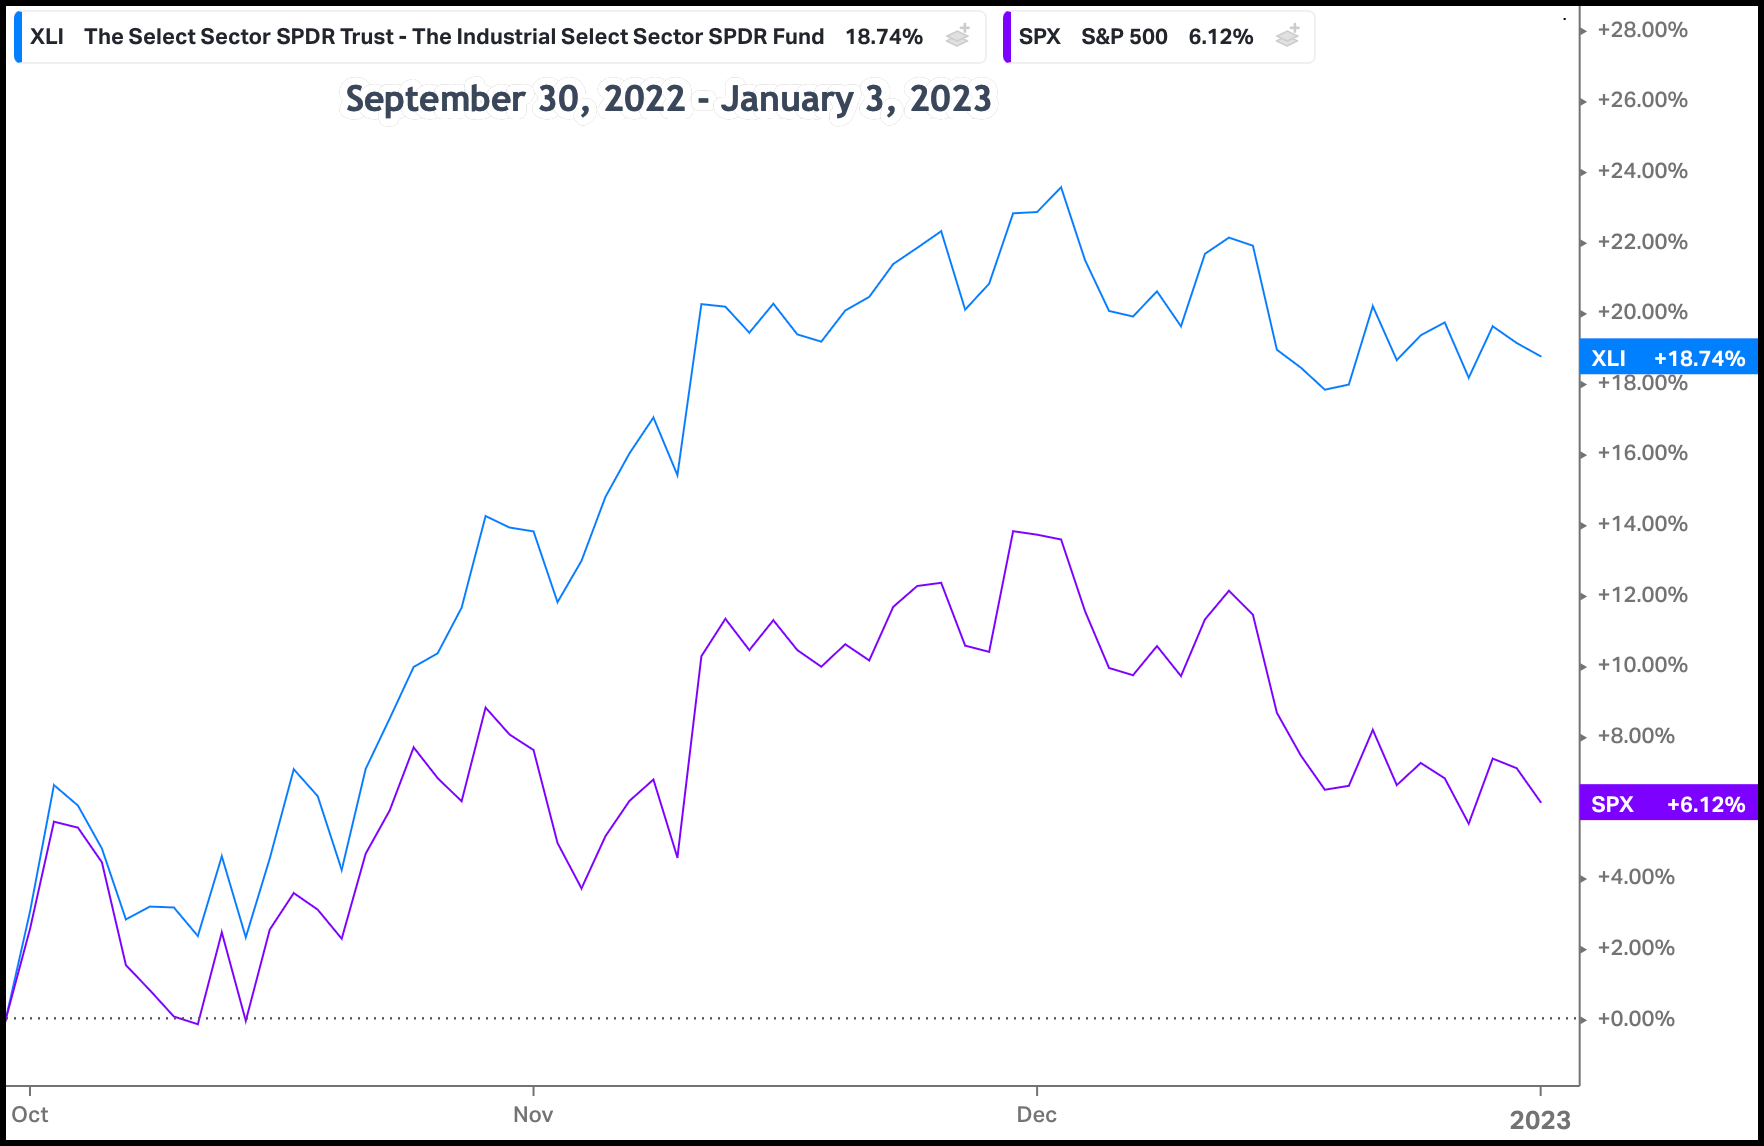
And Industrials haven’t disappointed over the last 3 months.
So while the S&P gained +6.12% over the previous 3 months, Industrials provided outsized gains of +18.74%.
I said that Industrials are the most correlated sector to the broader market. You’ll better understand why when you look at this list of industry groups that live in the broad Industry sector (XLI).
- Aerospace and Defense
- Transports including Air Freight and Logistics companies
- Road and Rail – these are truckers and R/R
- Machinery and Professional Services companies
There’s a little something for everybody in this sector, but there are two categories that have really stood out: Aerospace and Transports.
To help visualize the recent strength in the Aerospace sector, here’s the price chart of the Dow Jones US Aerospace Index ($DJUSAS). See the impressive move off the October lows on the price chart?
And price is doing something that’s been elusive to many sectors and industry groups this past year – they’re above both the 50- and 200-day moving averages, well above.

The lower pane of the chart above is a Relative Strength ratio, illustrating the strength of the Aerospace index vs. the S&P 500 index.
And then there are Transports. More specifically, Commercial Vehicles & Trucks.
Seen here through the lens of the Dow Jones US Commercial Vehicles and Trucks Index ($DJUSHR).
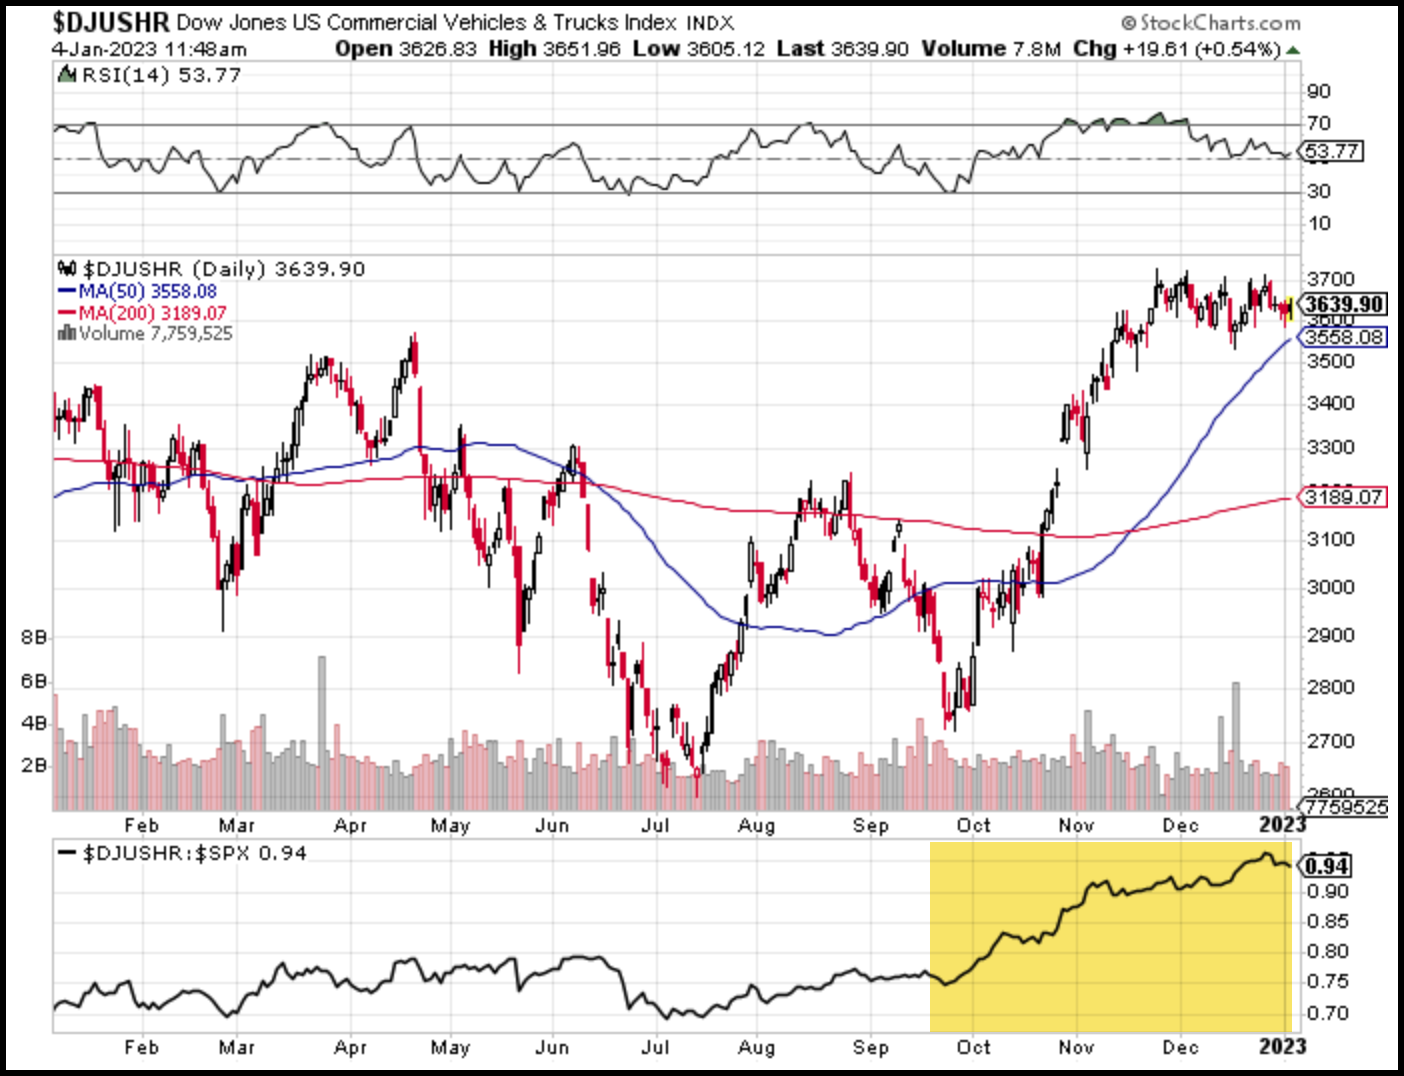
Similar to the Aerospace index, the upper pane is the price chart, moving well off its June and October lows. And DJUSHR remains above its 50- and 200-day moving averages.
What is not visible in the one-year chart is that the Commercial Vehicle & Trucking index recently reached an all-time high.
Imagine that, an all-time during a bear market! It can happen.
The message to impart here is that we’re seeing breakouts in industry groups within the Industrial complex over the last few months – and it’s happening while former leaders like Apple, Inc. (AAPL), Tesla, Inc. (TSLA), and Alphabet, Inc. (GOOGL) all continue to break to new lows.
So money isn’t exactly leaving equities – it’s rotating to other sectors and specific industry groups.
If you have any questions or have been considering hiring an advisor, then schedule a free consultation with one of our advisors today. There’s no risk or obligation—let's just talk.
Tags

Free Guide: How to Find the Best Advisor for You
Get our absolutely free guide that covers different types of advisory services you'll encounter, differences between RIAs and broker-dealers, questions you’ll want to ask when interviewing advisors, and data any good financial advisor should know about you and your portfolio.
