
Related Blogs
February 7, 2022 | Avalon Team
 In the spirit of the Olympics, let’s discuss the idea of home-country bias as it relates to investing – particularly here in the United States.
As part of what I do here, I’m often asked to review prospective clients’ portfolio holdings and allocations to provide feedback…
And I must admit, it’s been a long time since I’ve reviewed a portfolio with anything more than the occasional token International stock – this is particularly true of American investors.
Talk about home country bias! It’s as though investors here in the U.S. think we always win the gold medal.
I realize for a lot of “newer” investors, all they’ve known is a market in which U.S. growth stocks have overshadowed their International value peers.
And it’s true that, with few exceptions along the way, growth has been the place to be for the last decade with the greatest gains found in tech-heavy, U.S. stock markets.
It’s been this way for a long time and for a very simple reason: There are far more value and cyclical stocks overseas than in U.S. markets.
And the last decade has been a market dominated by growth stocks.
So I can understand a little home bias for those of us residing here in the United States.
But it would be a mistake to think that the U.S. will always sit atop the podium…
So, is now the time to expect a new gold medalist?
It’s possible. We’re beginning to see the tide shift in favor of value – something I’ve written about extensively the last several weeks.
And with that shifting tide towards value over growth, we’re also beginning to see early signs of reversals in the U.S. vs. World relative trends.
Today, I’m going to give you a look behind the curtain, to see a few developing trends that we’re watching closely.
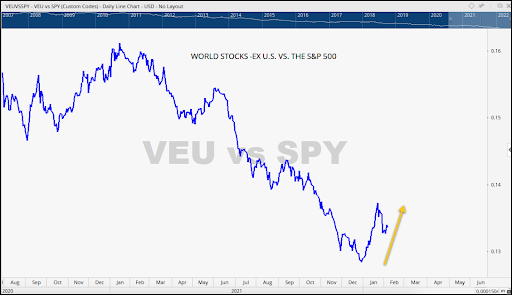
The chart below is a Relative Strength ratio chart comparing the strength of Global equities excluding U.S. stocks compared to the S&P 500.
There’s a clear trend of outperformance by International equities over the domestic S&P 500, beginning in late December 2021.
We can see a similar trend developing in Emerging Markets as well.
Here is a Relative Strength ratio chart comparing Emerging Markets to the S&P 500.
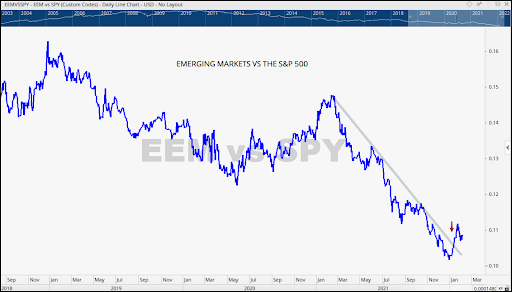
After being in a significant downtrend vs. the S&P 500, Emerging Markets (EEM) is now favored over U.S. markets (S&P 500).
And Emerging Markets (EEM) just broke out above a year-long downtrend line (the red arrow). This is a positive development adding to a narrative of International Markets over the U.S.
We’ll want to keep an eye on EEM to see if it retests that down trendline and/or can continue higher from here.
In the “did you know” column… China makes up over 30% of EEM.
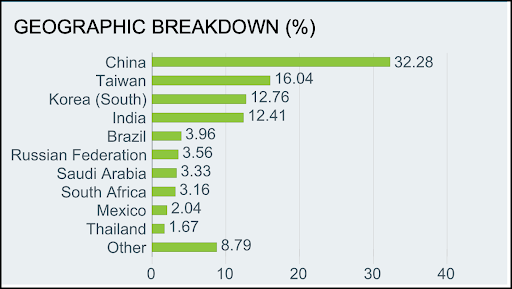
That matters, because China’s stock market has gotten smoked over the last year causing a drag on the performance of EEM.
Below is a Relative Strength chart comparing EEM to the S&P 500 vs. an RS ratio of EMXC vs the S&P 500. EMXC represents emerging markets excluding the China drag.
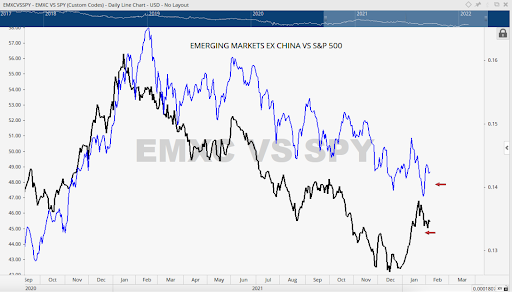
What I want to point out is the strength in emerging markets excluding China (black line) vs. EEM that includes the China drag (shorter blue line).
Even with the significant strength of Emerging Market countries, excluding China, there is still more work to be done before we have the conviction to favor international stocks outright, but the weight of the evidence continues to move in that direction.
And now, I’m going to share a market I’ve had my eye on since the early days of January ‘22.
Brazil – yes, Brazil. Among one of the worst-performing global equity markets since the COVID crash.
But before you scratch your head, take a look at the Relative Strength coming out of Brazil today.
And as the saying goes, “Where there’s relative outperformance, we expect to find absolute outperformance.”
And that’s exactly what Brazil has provided since January 1, 2022.
Brazil (EWZ) has more than doubled the return of U.S. growth and the S&P 500 Index.
Check out this Year-to-Date Performance chart – Brazil (EWZ) +12.86% vs. United States (SPY) + 5.57%.
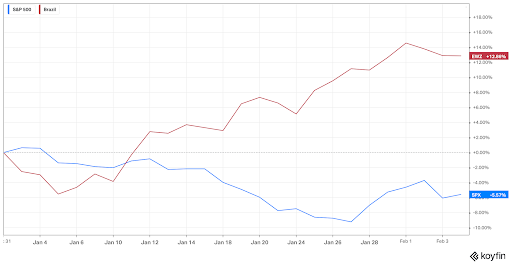
I’d venture to say that, if investors had more of their capital allocated to countries like Brazil, rather than the U.S., they’d be singing a very different tune about how they feel about “markets” in 2022.
See what home country bias can do?
Oh well, back to Brazil for a moment…
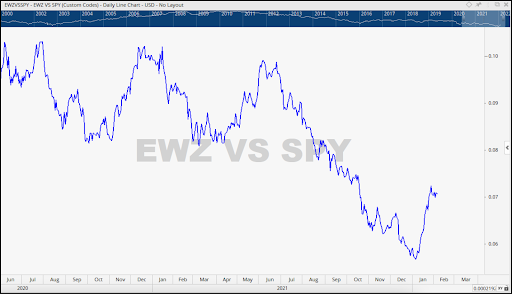
Here’s a long-term ratio chart comparing Brazil to the U.S. S&P 500 index (SPY) going all the way back to 2002.
It’s interesting that Brazil is finding support in the same area where they began their incredible run 20 years ago. Coincidence? Probably not…
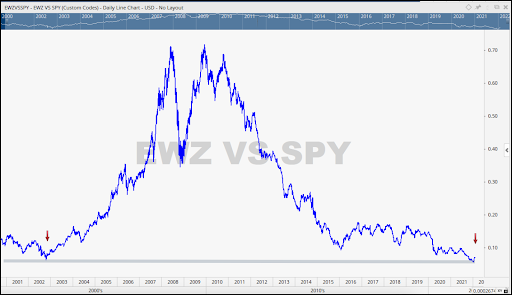
This is definitely a solid start for Brazil, but structurally, Brazil (EWZ) is still in an ugly downtrend, so investors will want to see some additional follow-through moving forward to confirm this reversal is legit.
There’s another very good reason why we have a close eye on Brazil right now – it’s the same reason we’re watching many countries overseas right now.
It’s because of their heavy exposure to value stocks.
Over 2/3s of Brazil’s index is allocated to Materials, Financials, and Energy stocks, all of which we’ve discussed for weeks, as an area to overweight right now.
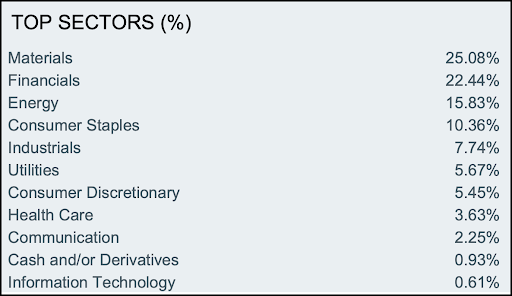
Because of Brazil’s heavy tilt towards value stocks, their newfound relative and absolute outperformance shouldn’t be too surprising.
It’s what we’d expect to see if the rotation from growth to value persists.
The message I want to get across here isn’t just about Brazil.
Yes, Brazil’s chart is cool and investors could certainly consider it, assuming it fits with your own risk tolerance, time horizons, etc.
What I think is more important than just Brazil is that for the first time in years, we’re seeing strong evidence of a reversal in these relative trends that would favor international indexes and their value components over the S&P 500 index or NASDAQ and heavy growth allocations.
And just to prove this isn’t just a Brazilian phenomenon… here’s one more example: a country that shares a border with the United States.
Canada: Look at the move off the 2020 COVID lows.
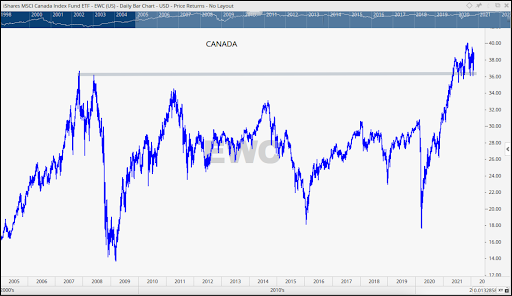
And see how price is consolidating above its pre-financial crisis highs, instead of below them, like so many others? The ability of this index to remain above those levels reflects the strength out of the Canadian market.
There is a lot to like about Canadian stocks. When we talk about value stocks around the world, Canada should be one of the first countries that comes to mind.
So, assuming these trend reversals stick, a shift away from U.S. markets in favor of International stocks would make a lot of sense.
If you have any questions or have been considering hiring an advisor, then schedule a free consultation with one of our advisors today. There’s no risk or obligation—let's just talk.
Tags

Free Guide: How to Find the Best Advisor for You
Get our absolutely free guide that covers different types of advisory services you'll encounter, differences between RIAs and broker-dealers, questions you’ll want to ask when interviewing advisors, and data any good financial advisor should know about you and your portfolio.
