
Related Blogs
September 8, 2023 | Avalon Team
Next week we’ll send out our September monthly chart review.
For those of you not familiar with it, this is a down-and-dirty 15-minute market review where we discuss some of the most important charts investors need to see.
This is easily one of the most valuable insights we share with our readers free of charge, as it forces us to pull back from the day-to-day noise of the markets and examine markets from the big-picture point of view.
By focusing on long-term, monthly charts, we can take a step back and put things into the context of their structural trends.
And as the saying goes, “The trend is our friend.”
It pays to know the direction of the long-term trend.
There are a few important themes that we’ll discuss in next week’s video…
Messy for Longer
The S&P 500, Nasdaq, and DJIA have all resolved higher from what can best be described as textbook reversal patterns off the April lows…
But the second half of 2023 has not looked anything like the first half.
Investors anticipating a strong Q4 are going to have to hope a little harder. The charts we’ll cover next week will help put the current market into perspective.
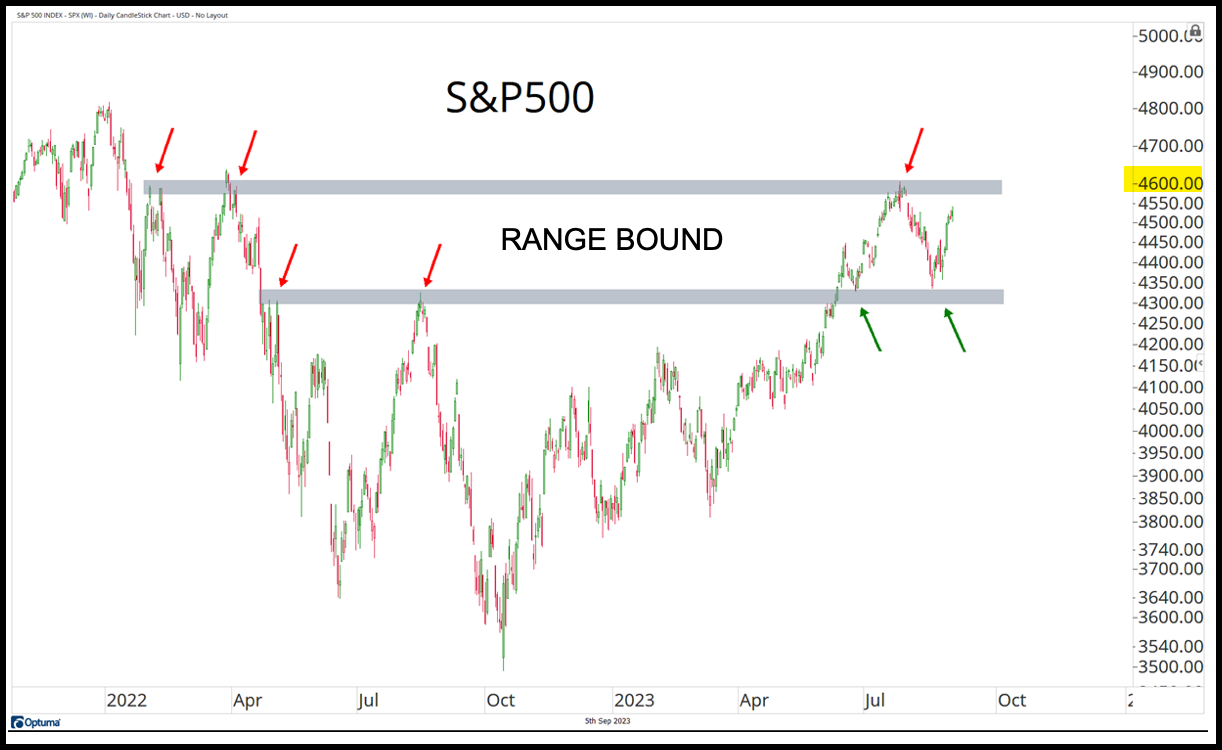
The S&P 500 has been range-bound and any hope for higher prices means the S&P must absorb all that overhead supply at or around 4600.
And until it does that, expect markets to remain stuck.
Seasonal Headwinds Intensify
Equity markets have followed this particular seasonal trend to a tee since last year and we see little evidence of that changing anytime soon.
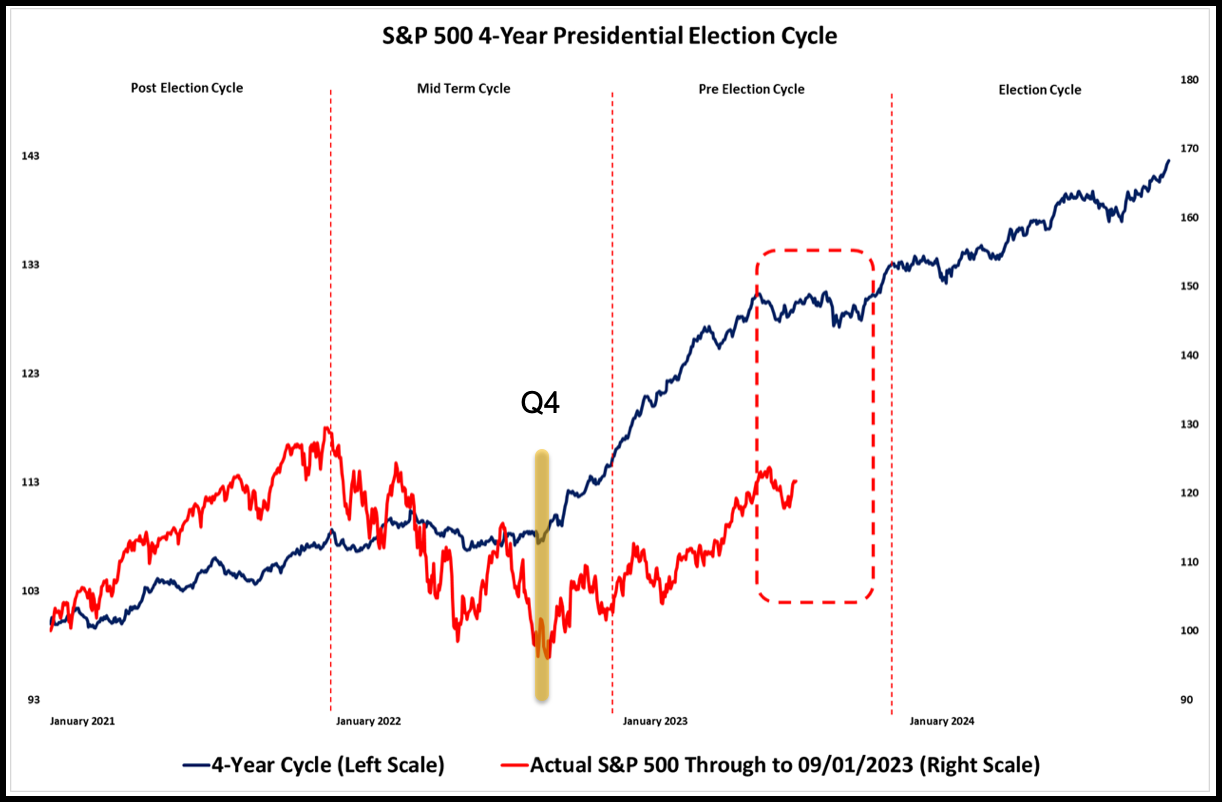
The second half of the mid-term year (Q4 2022) and the first half of the pre-election year are when stocks tend to perform the best.
And they didn’t disappoint as seasonal trends became a major tailwind for U.S. equities coming off the October 2022 lows.
But this bullish seasonal period is now behind us (at least temporarily) and the next quarter or two have been weak historically.
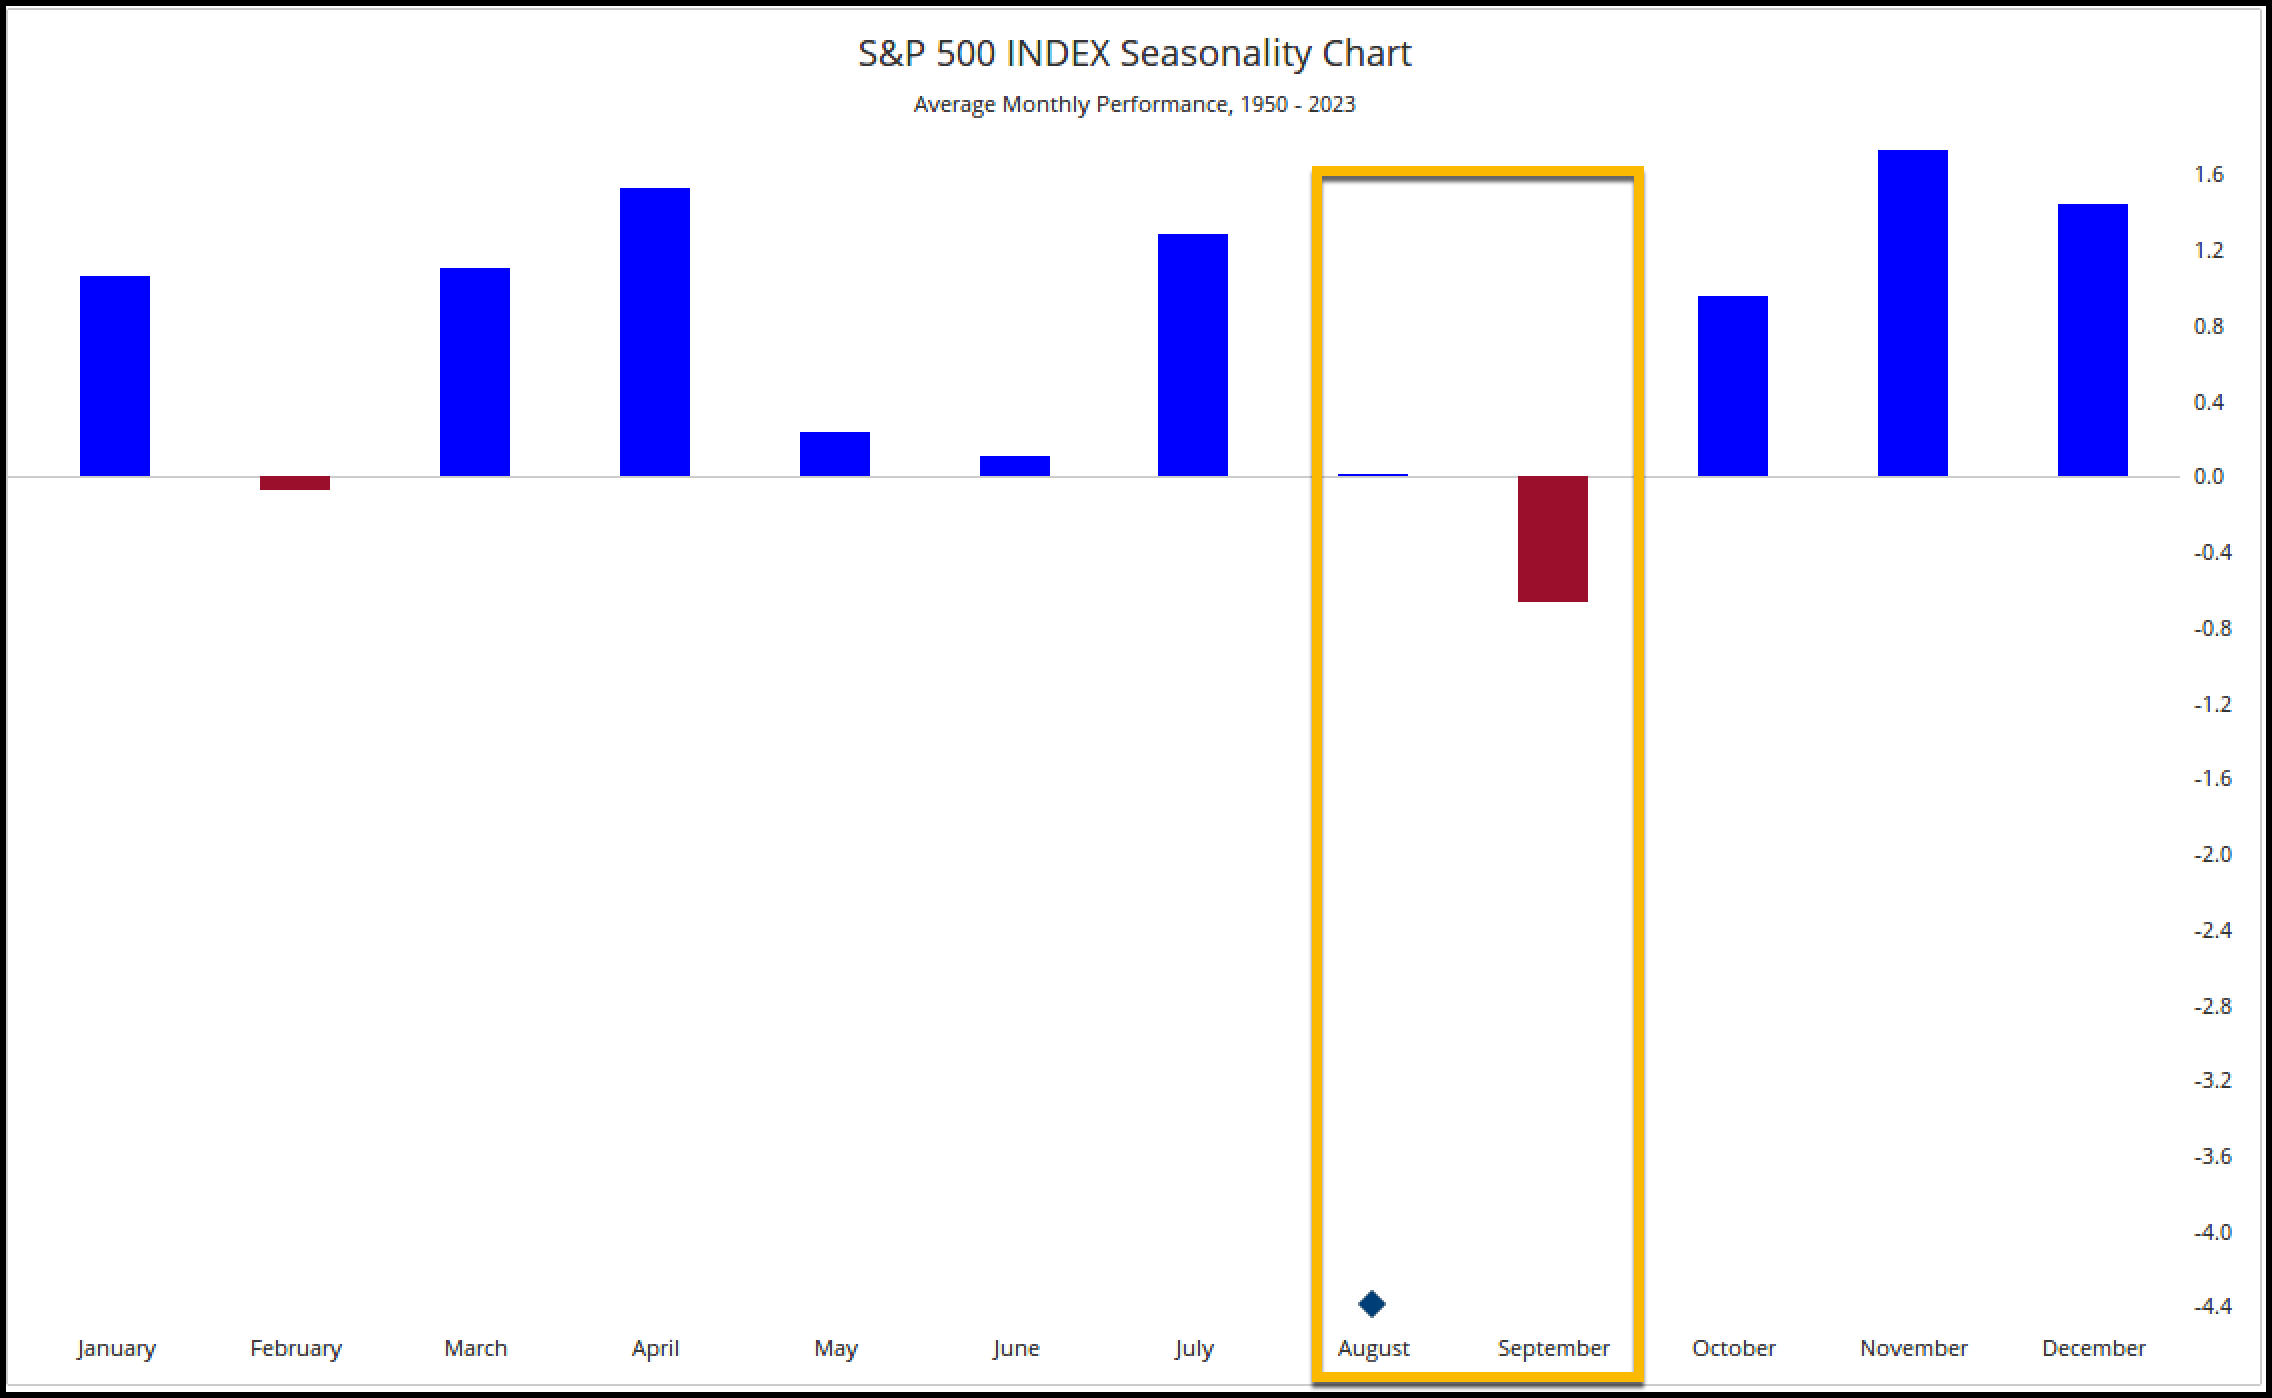
This corrective phase in the Presidential Cycle lines up with the beginning of September, which is historically the worst month for market returns.
So we can’t rule out stocks remaining weak for the foreseeable future.
Don’t Sleep On Commodities
For sure, U.S. equities have been the dominant force all year, both on a relative and absolute basis. But it looks as though Commodities may be ready to reassert themselves.
Here’s the S&P 500 index relative to the CRB Index:
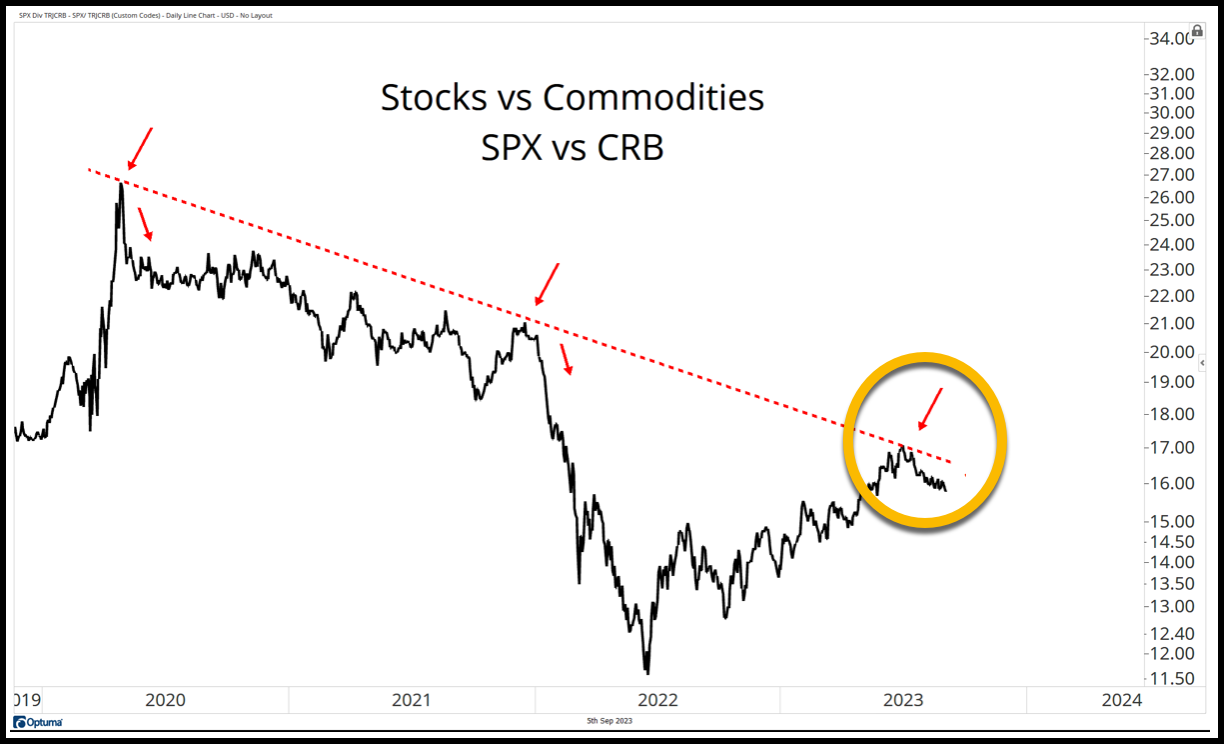
The large-cap dominated S&P 500 has shown very clear strength vs. Commodities all year.
However, stocks on a relative basis have run into an area that is serving as resistance to further highs. And according to the charts, stocks have been turned away from further upside.
This area of resistance, at this downtrend line, would be a logical place for Commodities to reassert their previous leadership role.
Under this scenario, the commodity supercycle thesis is still in play.
More on this and the markets next week, so stay tuned.
If you have any questions or have been considering hiring an advisor, then schedule a free consultation with one of our advisors today. There’s no risk or obligation—let's just talk.
Tags

Free Guide: How to Find the Best Advisor for You
Get our absolutely free guide that covers different types of advisory services you'll encounter, differences between RIAs and broker-dealers, questions you’ll want to ask when interviewing advisors, and data any good financial advisor should know about you and your portfolio.
