
Related Blogs
February 9, 2018 | Michael Reilly
 Tuesday morning there was an email in my inbox with the subject line, “Sell, sell, sell.”
I have to admit, it got my attention. It was a dire warning from a contrarian investment “guru” forecasting the end of the bull market — and the world as we know it.
If you sold some stock near the recent short-term bottom, you’re obviously not alone.
Monday’s one-day decline of the Dow Jones Industrial Average — a 4.6% drop — was the biggest one-day percentage loss since 2011.
The S&P 500 lost 4.6% on Friday, and another 3.5% Monday — a total market loss of over $1 trillion dollars.
February has hardly started with a bang. Every U.S. Equities sector experienced losses in the pullback, especially interest rate sensitive sectors like the Utilities sector.
But the hardest hit was Energy (RYE), with two-day losses of 7.1%, compounded by falling oil prices.
And the two strongest sectors on a RS basis, Technology (RYT) and Financials (RYF), fell by 6.3% and 6.0%, respectively.
With bond yields higher than they’ve been in years, and worries that rising inflation might cause the Fed to increase interest rates more quickly, fearful investors shed stocks, erasing the market’s year-to-date gains.
But is it time to be fearful?
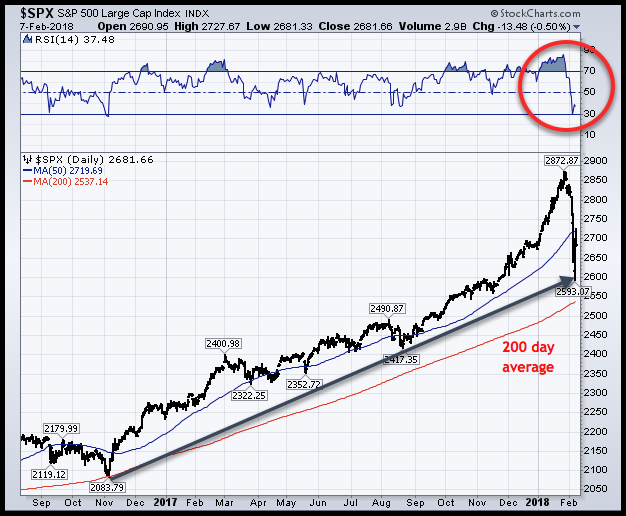
Well, the bad news is the S&P 500 fell 8.1% in just two days, breaking below a key technical level – the 50 day moving average (blue line).
A break below the 50-day moving average is significant because the market is dominated by computerized trading.
Many of these computers are programed to automatically trade (buy or sell) securities that breach their 50-day moving average. This becomes a “moment of truth” scenario as the algorithms must also determine if they should be buyers or sellers at the 50-day moving average.
Investors with an intermediate-term time horizon focus on this moving average and it appears as though the intermediate-term picture has weakened dramatically.
That selling pressure pushed the index well below the 50-day and drove the S&P all the way down to its next area of meaningful support – 2600.
We found this support by drawing a rising trend-line under the November 2016 and August 2017 lows near 2600, and extended it out.
If that weren’t to hold, the 200-day moving average would likely be the next area of potential support.
That’s the bad news. Now for a healthy dose of optimism with some good news.
Look closely again at the chart. Support at 2600 has held, thus far. The S&P reversed, crossing back above the 50-day moving average. As of now, the 50-day moving average acts as a new ceiling (resistance level). It is now where some computers are programmed to automatically sell (whenever the S&P 500 moves back up to that level).
This technical “obstacle” should be viewed as a healthy one. Without price barriers to overcome, we will never have useful clues alerting us to when the stock market is once again on solid footing.
Let’s look at a popular momentum indicator.
The 14-day RSI line (top of chart — circled in red) hit what is considered an oversold level at 30, then moved back above 30.
The last time this happened on the S&P was late 2016.
What does this mean?
The Relative Strength Indicator, or RSI, is a popular indicator with technicians that measures the speed and change of price movements.
The indicator oscillates between zero and 100.
Traditionally, the RSI is considered overbought when it moves above 70, and oversold when below 30.
A buy signal occurs when the RSI falls below 30 then reverses back above 30, while a move from above 70 to below 70 on the RSI is considered a sell signal.
The S&P had been in overbought territory since the start of the year – as seen on the chart. As it stands today, the index has moved from overbought to oversold.
We know how volatile markets have been over the previous two weeks. Volatility has soared.
The chart below shows the CBOE Volatility (VIX) Index, often used as a measure of fear. It more than doubled in value to the highest level since 2015.
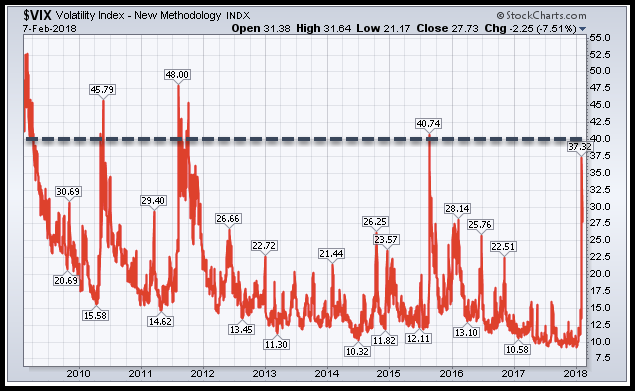
The silver lining is that the three previous moves above 40 coincided with market bottoms.
So, it’s possible the VIX is once again signalling that the drop in markets have found a bottom.
Despite the decline, U.S. Equities and International Equities still form the strongest asset classes by Relative Strength — so there’s no reason to jump into cash.
Within U.S. Equities, Technology and Financials remain the strongest sectors. This has been the case for about a year, which is why we’ve kept our clients heavily weighted in those groups.
Within International Equities, Europe Emerging is the strongest sector by geography, and Asia-Pacific Emerging has replaced Asia-Pacific Developed as the second-strongest International Equities sector. Diversified Emerging Markets as a whole are also extremely strong. Again, this is where our clients remain invested.
The Single Biggest Mistake During a Price Correction
Emotional trading is one of the greatest mistakes that leads to underperformance — selling low out of fear is no way to get ahead in the markets.
That’s why we constantly remind our clients: “It doesn’t matter how well any of our models perform for you if the potential volatility doesn’t match your comfort levels.”
We show our newer prospects the history of our models and we tell them we can’t blindly choose the best performer for them. This is because, those prospects probably would have sold out of fear when volatile markets affected our most volatile model.
The first step is to find the models our clients can feel comfortable in, even during a sharp correction.
Whether you work with Rowe Wealth Management or not, make sure your investment advisor understands the importance of relative strength investing. Having a Relative Strength wealth manager can help prevent emotional selling.
I say “help,” because even if we’re managing all or only part of your accounts, you are still in charge — it’s your money, and you can do what you want with it.
But as your financial advisor, we can strongly urge you to stay in the allocations we’ve chosen for you, so you can follow the strongest trends for as long as those trends continue. The current trend is still in play, and until we see numbers that suggest otherwise, we’re sticking to it.
To find out more about what we do and how we can help you reduce risk and sleep more easily during the market’s ups and downs, schedule a consultation with us right away.
Tags

Get Our FREE Guide
How to Find the Best Advisor for You
Learn how to choose an advisor that has your best interests in mind. You'll also be subscribed to ADAPT, Avalon’s free newsletter with updates on our strongest performing investment models and market insights from a responsible money management perspective.
