
Related Blogs
November 11, 2021 | Michael Reilly
According to historic seasonal trends, the best time of the year for the stock market is from November to January.
Here’s something that can give you an investment edge…
November is by far the single best month of the entire year for small-cap stocks.
In fact, November of 2020 was the best month ever for the small-cap index.
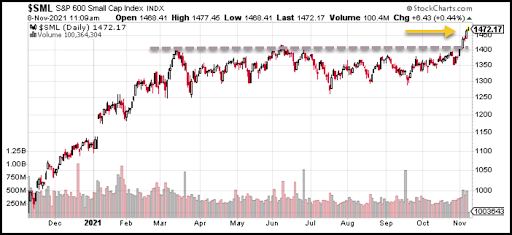
After grinding sideways since March of this year, the S&P 600 Small-Cap Index finally woke up – dancing its way to all-time highs.
Below are the iShares Russell 2000 Small-Cap ETF (IWM) and the SPDR S&P 600 Small-Cap ETF (SLY) – two widely-diversified small-cap ETFs designed to track the performance of the Small-cap Index.
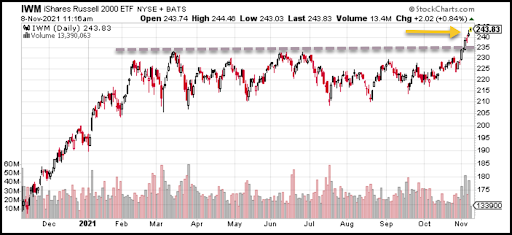
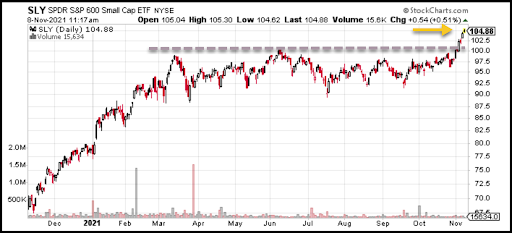
Both of these index ETFs just broke out to new highs.
So I ran a quick relative strength comparison between IWM and SLY – just to see if either fund provided investors a potential edge.
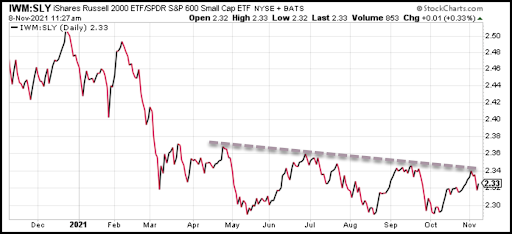
The results show that SLY currently holds a slight edge over IWM. Both funds have had the upper hand periodically throughout the year.
The declining line indicates IWM is underperforming its small-cap counterpart, SLY.
But based on the strength we’re seeing out of small-caps in general, I wouldn’t be surprised to see both ETFs perform well as we move into what has historically been a profitable time for small-cap stocks.
Check out these statistics for the Russell 2000 during the month of November based on the last 20 years of return data:
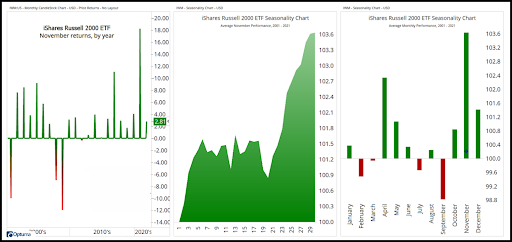
The index has been higher 85% of the time for an average return of 3.50%.
You can see this November strength in the chart image on the right. Notice how no other month’s performance comes even close to small-caps during November.
The chart on the left shows the monthly return for every November since 2000 and highlights last year’s record-breaking rally, when the index gained more than 18%.
Pretty compelling data! Investors shouldn’t wait too long to consider adding small-cap stocks to their portfolios.
Ok, so which small-caps?
Let’s break it down by sector. Below is what is called a “Relative Rotation Graph” or “RRG”
(it’s just a fancy way of saying the chart compares the relative strength of some of the small-cap sectors, to see if we can determine which ones are performing the best right now).
Our chart analyzes nine small-cap sector ETFs and compares them to their small-cap benchmark ($SML).
The sectors include: Technology, Materials, Financials, Consumer Staples, Consumer Discretionary, Energy, Utilities, and Industrials.
Hint: The groups in purple and green are the strongest.
Here’s what that looks like on a daily RRG right now:
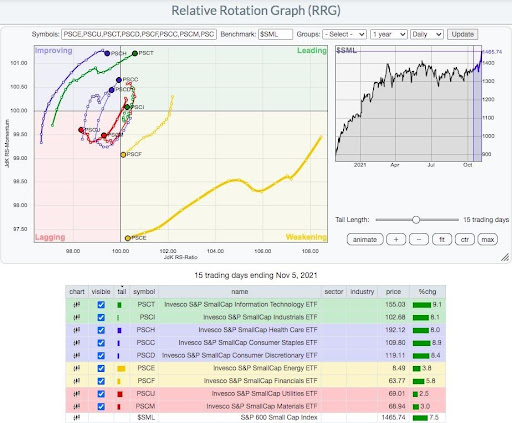
The two groups that look best right now, at least from an RRG perspective, are technology (PSCT) and industrials (PSCI).
Technology and Industrials are considered growth sectors. Investors are pouring money into two of the more aggressive sectors on the planet – small-cap stocks in high beta sectors.
These are things we expect to see in bull markets, not markets rolling over. And these are the kind of opportunities the investors I know, want to know about.
So go ahead, dig into some of the holdings of either the small-cap index funds or dig even deeper into the small-cap sector funds I’ve highlighted. I bet you’ll find some interesting opportunities to be had!
Until next week, invest wisely…

PS: Want these kinds of insights applied directly to your portfolio as they’re seen? To make the whole investment process easier, give us a call. We’re opening our doors to new investors who have portfolios valued over $500,000. If you’d like to schedule a free 1-hour consultation to review your portfolio, click here.
Tags

Get Our FREE Guide
How to Find the Best Advisor for You
Learn how to choose an advisor that has your best interests in mind. You'll also be subscribed to ADAPT, Avalon’s free newsletter with updates on our strongest performing investment models and market insights from a responsible money management perspective.
