
Related Blogs
May 19, 2022 | Avalon Team
Earlier this week, I put out a short video addressing current market conditions using price, breadth, and Relative Strength ratios as our guide.
The reasons we had moved all but a small portion of investor funds to the safety of cash are still very much in play, and based on the data, we believe the best decision remains to favor capital preservation over capital appreciation.
In other words, it doesn’t look to us that the selling is over or that a bottom is in.
I will say straight up: We are not here to call market tops or bottoms. The truth is, it’s only in retrospect that you can really ever know when a top or bottom has been identified.
We don’t have tomorrow’s newspaper today, but what we do have is the know-how to recognize the kind of market environment we are in…
And if we can do that, we can adapt our portfolios to protect our clients’ capital when markets are scary or profit when markets provide opportunity.
Let’s start with a chart of the S&P 500. Without getting too techy here, the S&P hit a peak at around 4800 in November 2021. Since then, it’s been grinding lower, falling to around 4200.
The problem is, it kept falling and fell through a few important price levels, which just reinforces our belief the market is weak in the knees.
If 4000 doesn’t hold, the index is likely to test the 3800 level and a break below 3800 means the S&P is looking at a 50% retracement of all the gains it made off the March 2020 COVID lows.

If that level breaks, investors could be looking at a move all the way down to the September 2020 lows. That’s a long way from here and a lot can happen between where we are and where we could go. I’m not saying we’ll get there – however, we want to keep those areas in mind as logical levels to find future support.
Let’s not kid ourselves – there is nothing bullish about this chart. Maybe it finds support at 4000-3800, maybe it doesn’t. Even if it does, it has a lot of work to do just to get anywhere near previous highs and it will likely run into resistance on the way.
Can the S&P 500 rebound from here? Sure – why not.
But what will be the catalyst? Higher rates? Nope.
Higher inflation? Nope.
Maybe the Fed’s decision to begin quantitative tightening next month will do the trick? Yeah, probably not.
Here’s something else – Participation (market breadth) is what percentage of stocks are moving higher in price or moving lower in price. Investors can’t expect bull markets unless more stocks are moving higher in price than are moving lower in price – it’s kind of a thing.
The chart below illustrates the Advance-Decline line of the S&P 500 index. It measures the percentage of stocks that trade on the S&P that are moving up in price compared to the percentage of stocks moving lower in price.

You see how the line went up? With the number of stocks moving higher in price exceeding the number moving down in price?
Yeah, that’s not happening anymore. Since November of last year more and more stocks have been moving lower in price than moving higher in price.
It’s happening in the S&P, it’s happening in the NYSE, and it’s happening in the NASDAQ.
We’re at 25 consecutive weeks and counting of more new lows than new highs in the NYSE and NASDAQ combined.
Not to overstate the obvious, but “where we were” and “where we are” are different investment environments with vastly different levels of risk.
Understand the environment you are in and invest accordingly.
The percentage of stocks trading above their 50-day and 200-day moving averages are between 20–30%… also not bullish, especially when you consider that just a year ago 80%–90% of stocks were trading above their 50- and 200-day moving averages.
Maybe of greater concern should be that in major bear markets, the percentage of stocks trading above their 50- and 200-day moving average can get closer to zero. And we’re nowhere near that yet.
You’ll see that when everything is bearish – when investors have seen enough and sell anything that might have risk.
Ya know, they say bonds lead equities. When there’s a problem in the equity market you’ll see it in the bond market first. One way to measure risk appetite and stress in financial markets is the Junk Bonds vs Treasury Bonds ratio (HYG/IEI).
When bond market investors are feeling good about the economy and are looking to take on additional risk, they bid up the price of High-Yield Bonds, this causes the ratio to rise.
When investors are nervous about economic conditions and are worried about companies meeting their future debt obligations they’ll sell high yield bonds and seek out safety with a move to Treasuries.
During these risk-off environments, the ratio tends to decline (Hint: It’s declining).
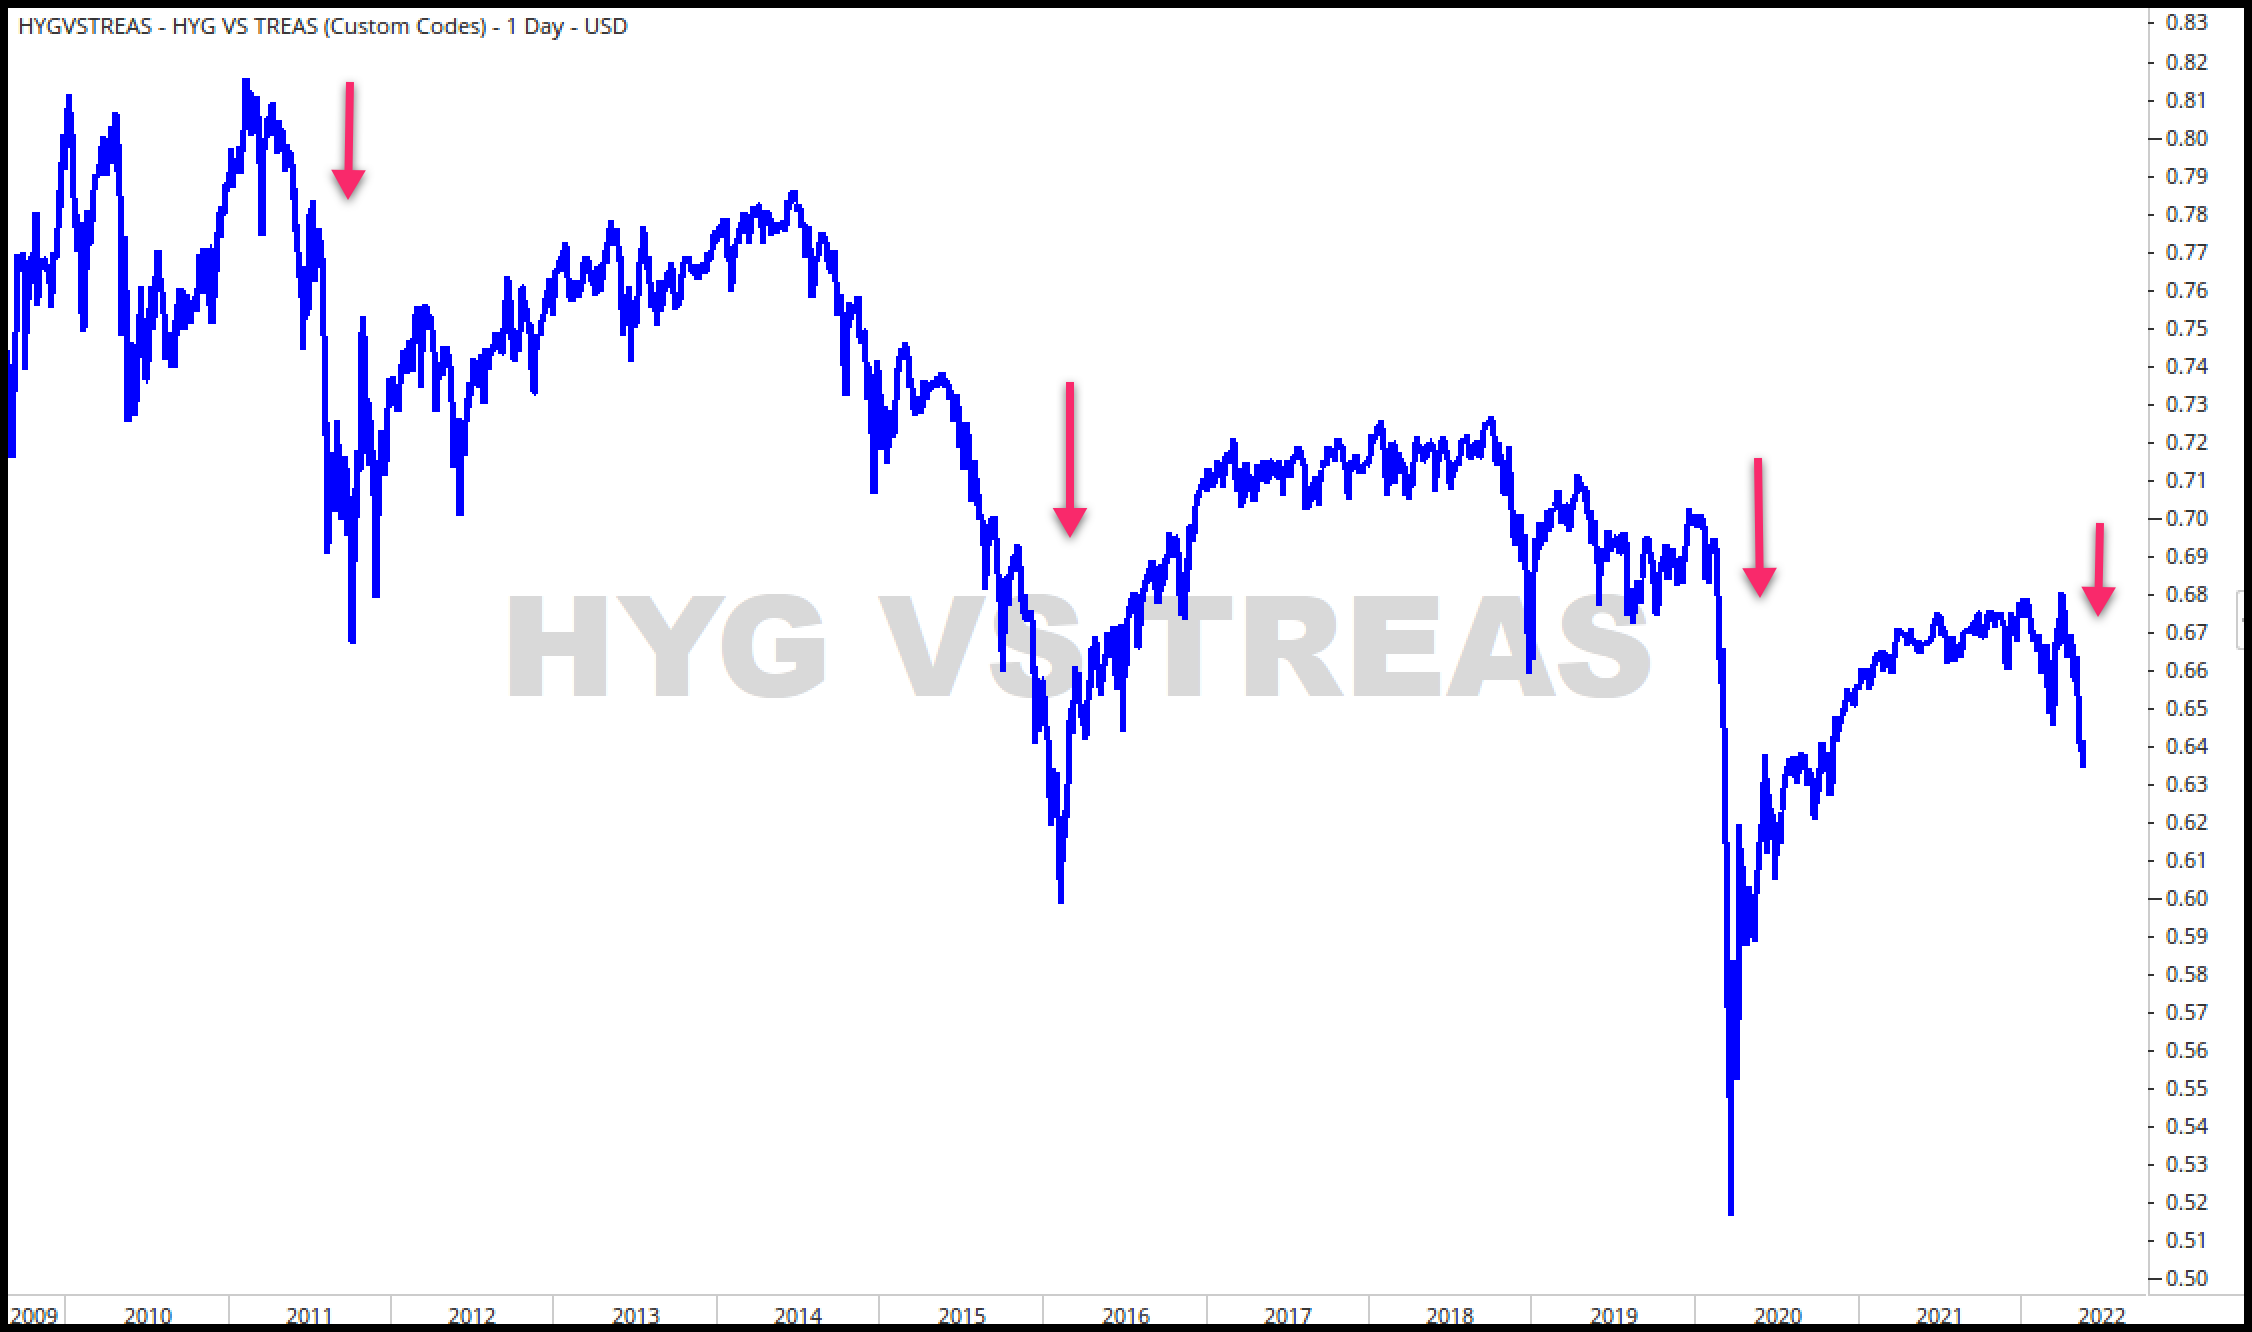
Take a look at previous dates when this ratio pointed to stress in equity markets: 2011, 2015, 2020, and 2022. As a barometer of risk this ratio has shown a strong correlation with equity markets on an absolute basis, so pay attention to what the bond market is signaling.
If the HYG/IEI ratio continues to resolve lower, we would expect lower stock prices to follow.
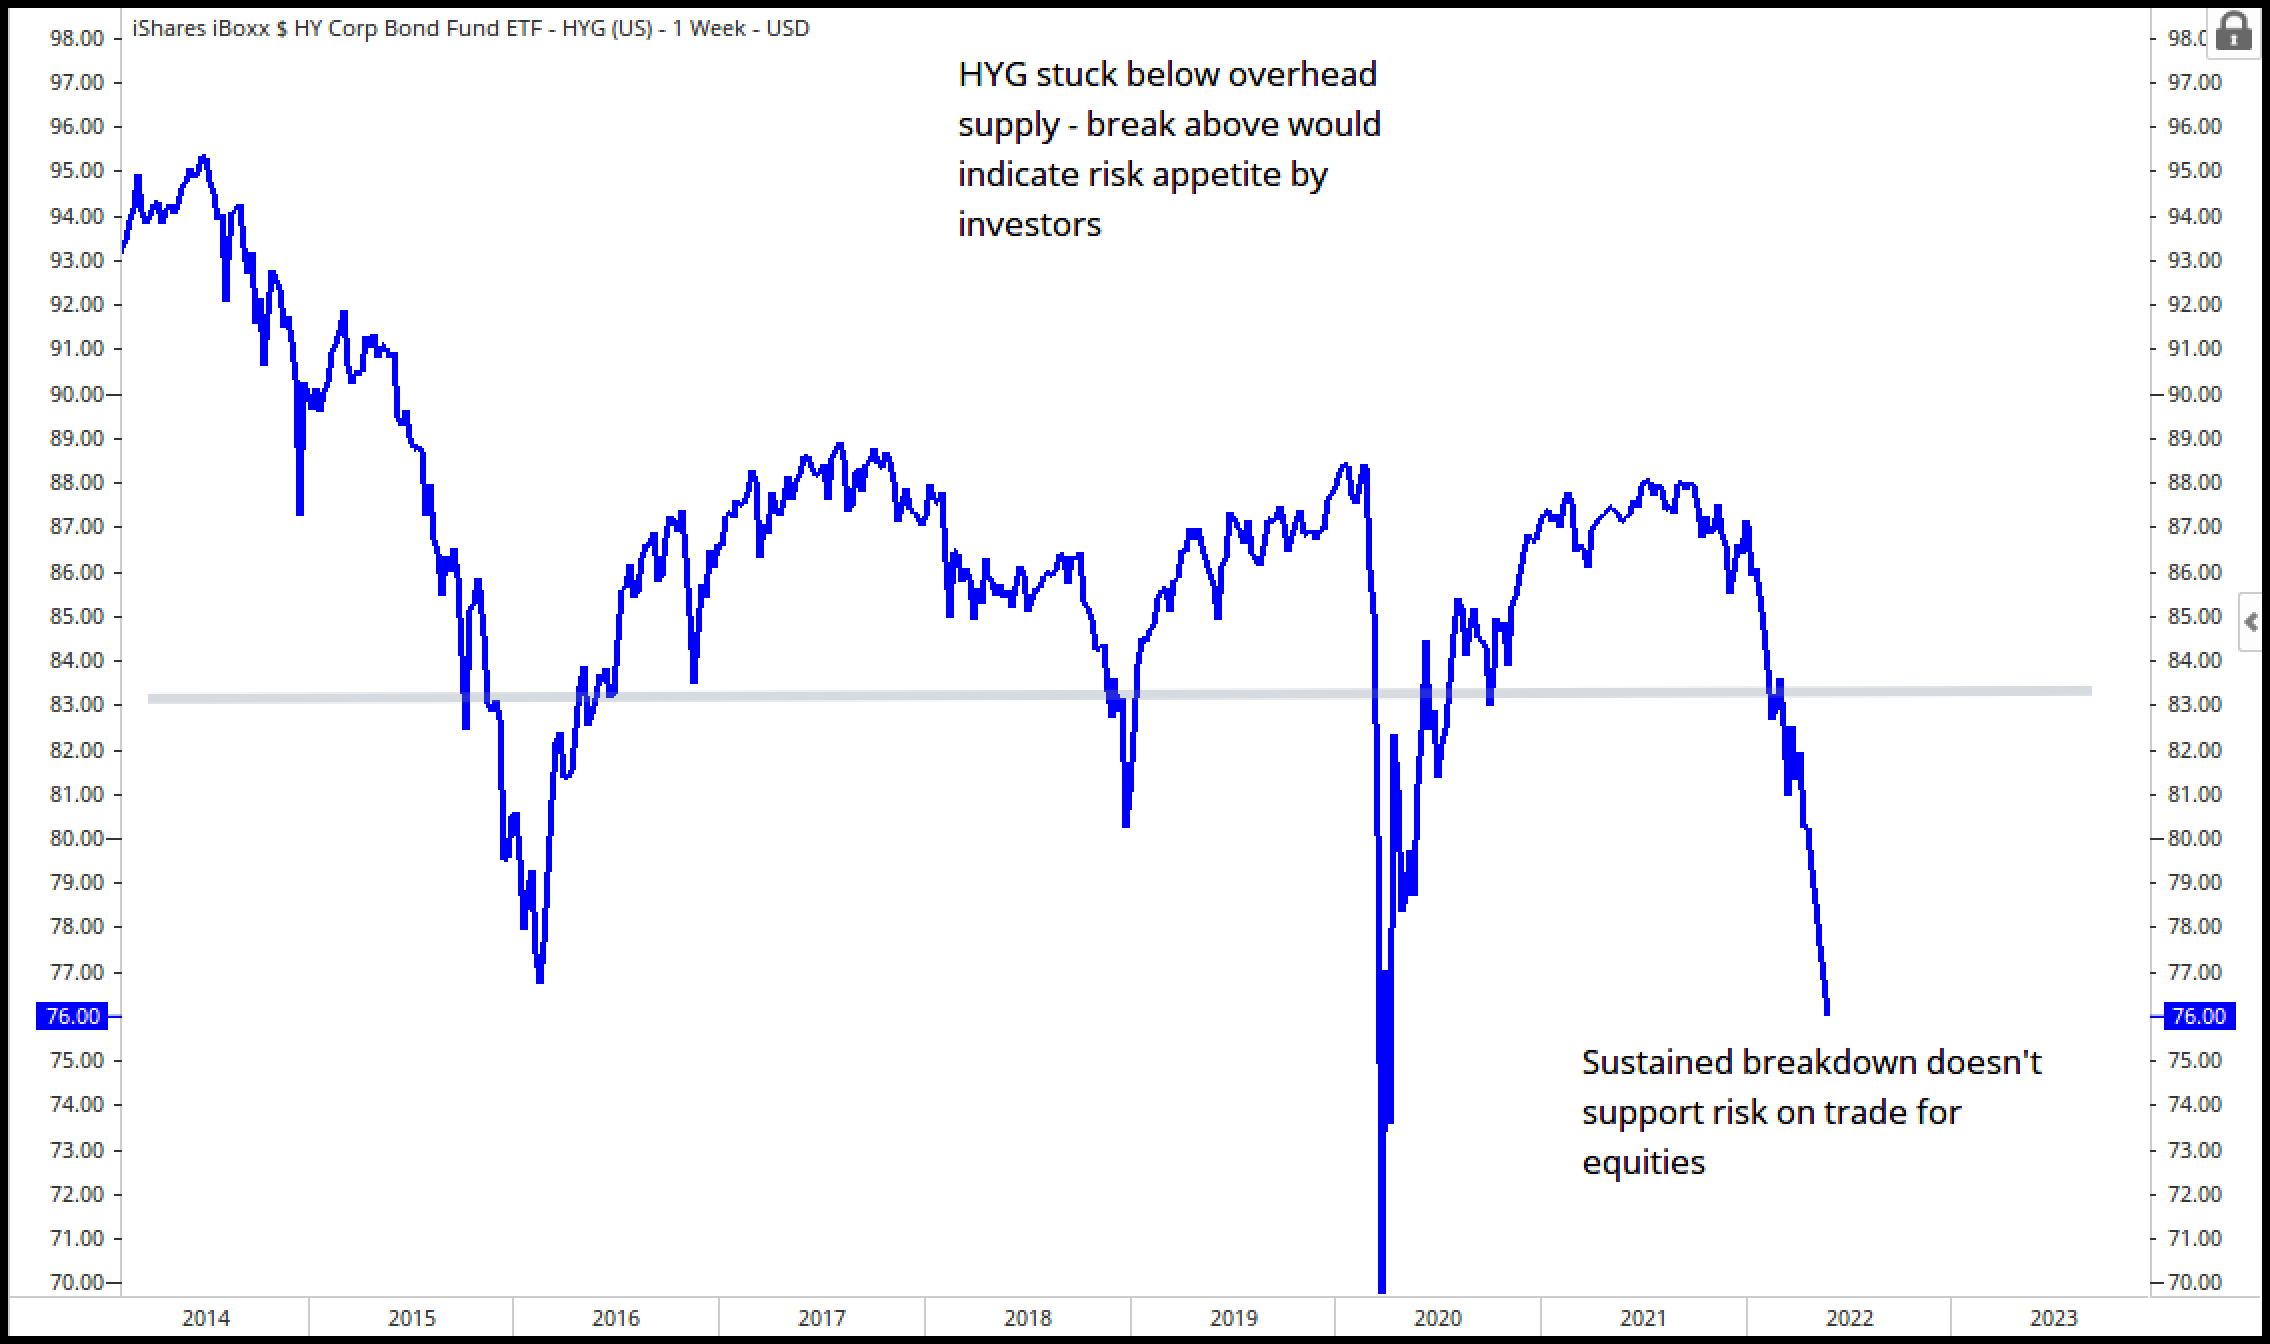
Here’s a price chart of HYG – the iShares High Yield Bond ETF.
The price chart looks a lot like the ratio chart above. Price declines of High-Yield bonds do not support a risk-on narrative for stocks.
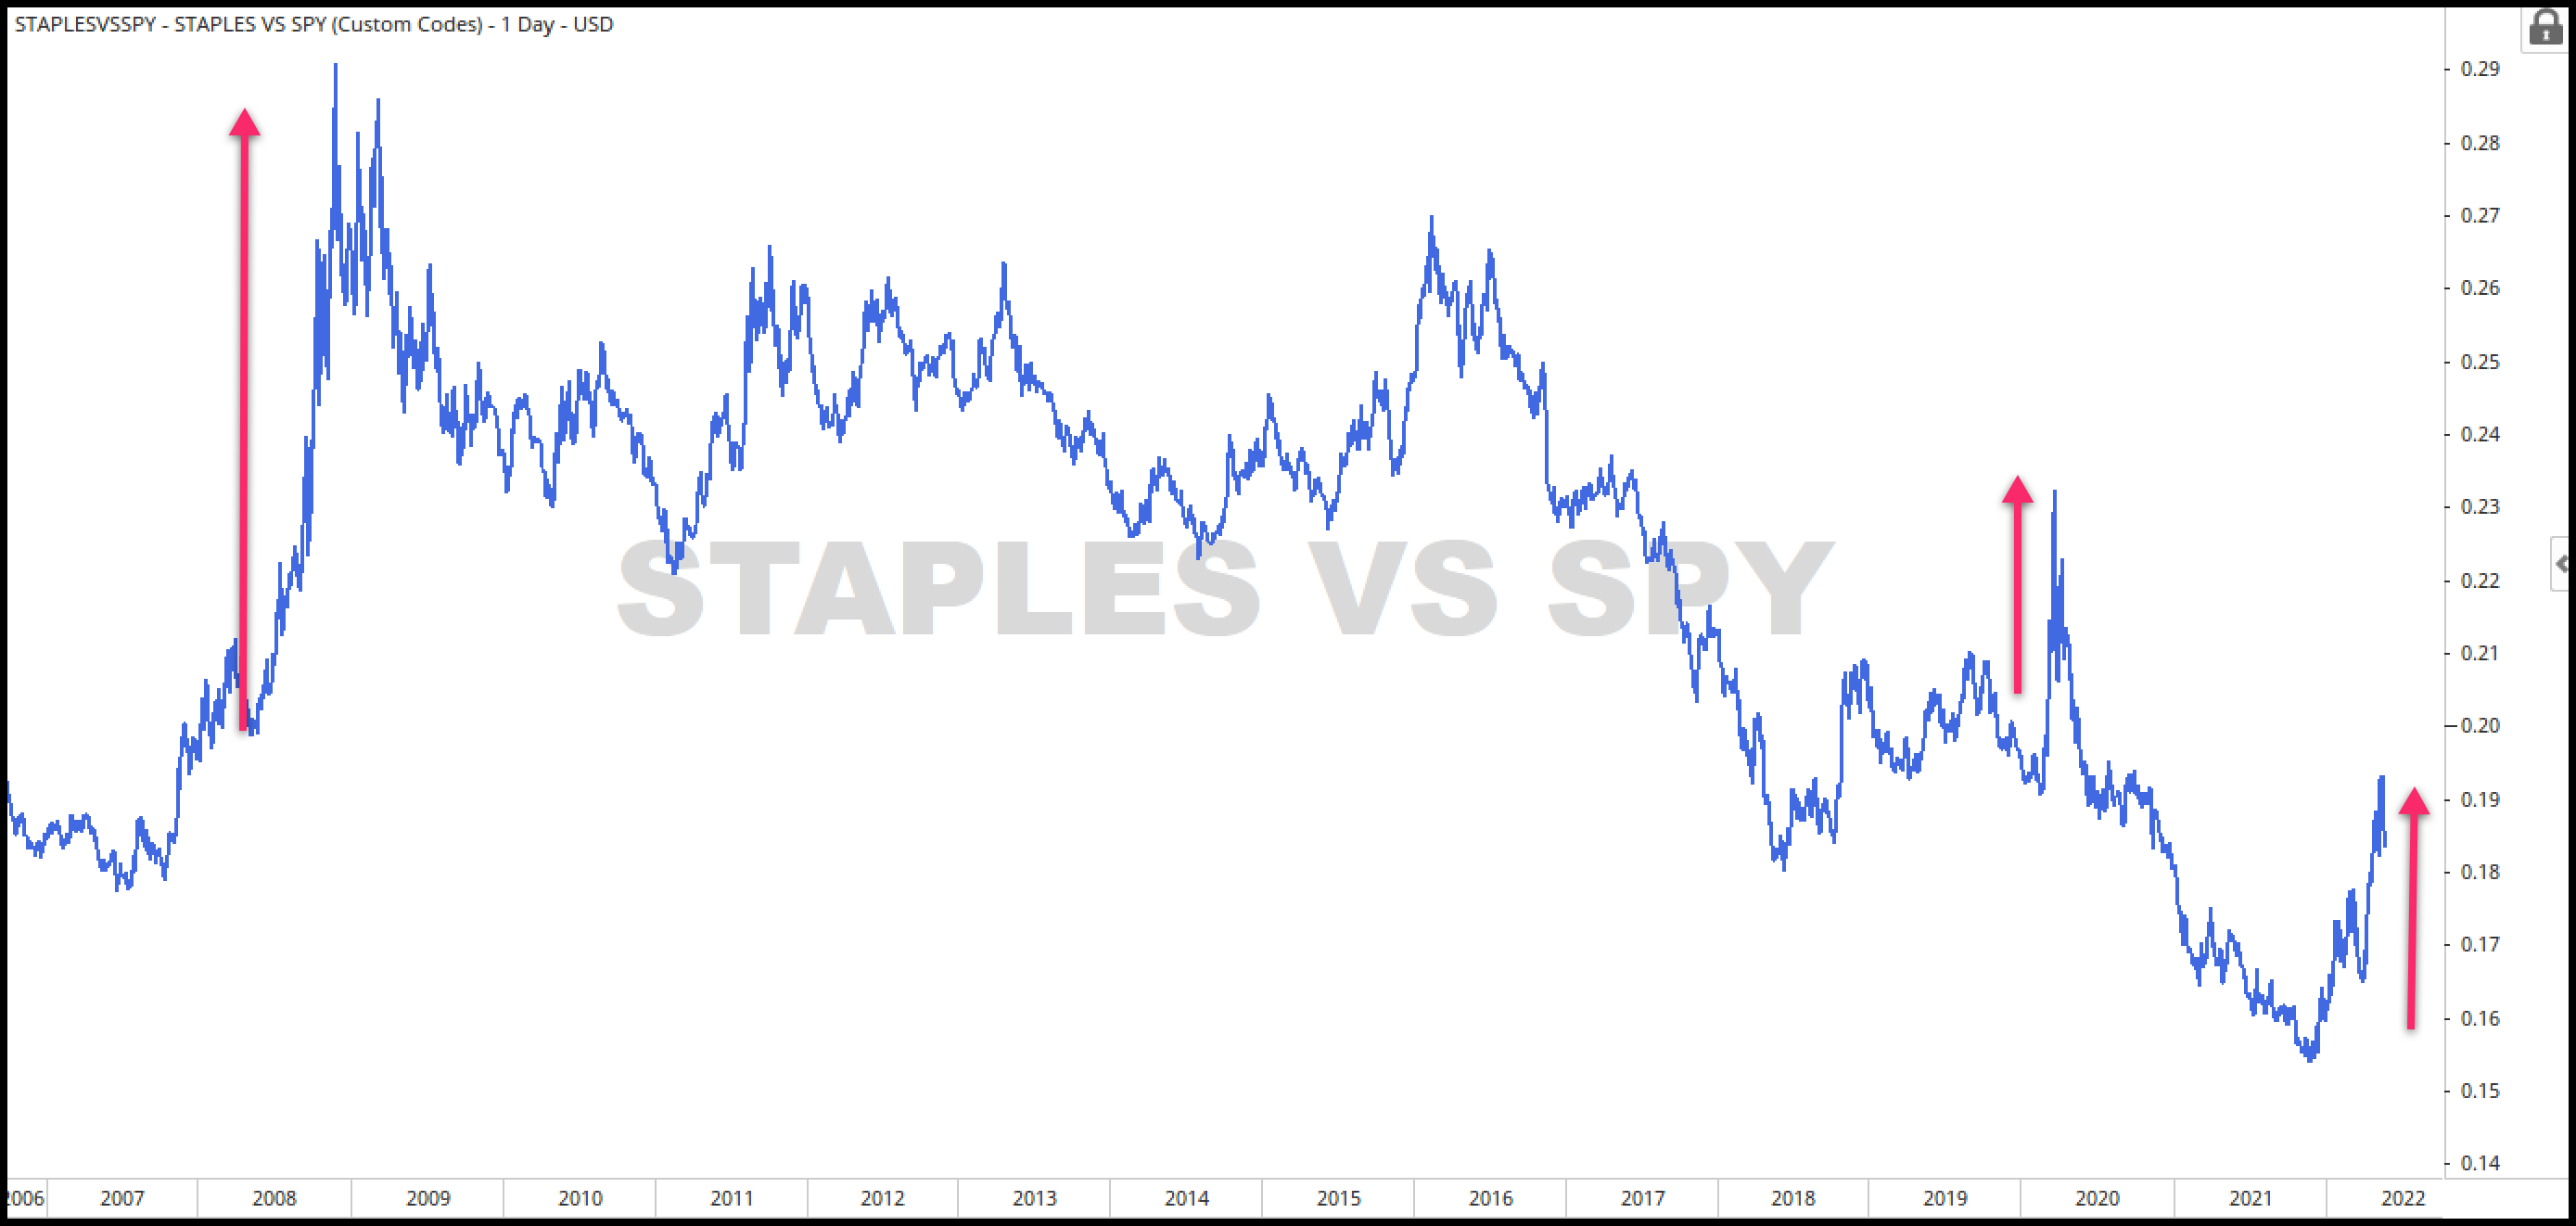
The chart below compares the price of Consumer Staples to that of the overall market – S&P 500.
Why? Because as investors we want to know if growth stocks are outperforming defensive stocks or are defensive stocks outperforming growth. This is risk-on vs risk-off analysis.
Staples is a defensive sector.
Just as a note: The fact that consumer staples may outperform the S&P 500 from time to time is not in and of itself worrisome – afterall, staples are stocks too.
When we take notice is when consumer staples stocks, in particular, outperform for long periods at a time. That’s a warning to investors.
Defensive sectors like consumer staples or utilities are not going to be market leaders when markets are humming along and it’s a risk-on growth environment.
To the contrary, when staples or utilities become leaders on an absolute or relative basis is when market participants are thinking more defensively and are looking for places to hide.
We’ve seen this before in 2008, 2011, 2016, and 2020. All times of previous market stress. And here it is in 2022 with Staples outperforming the S&P on both a relative and absolute basis.
Take a look at this chart below. This ratio compares the strength of consumer discretionary stocks to that of consumer staples stocks.
Consider it the consummate risk-on/risk-off or Appreciation vs. Preservation ratio.
Why’s it important? Because this is where the “long-only” investors live. Mutual funds don’t have the luxury of moving to cash when they are concerned about the direction of markets or the economy.
If these big mutual funds with all their research and data believe that the economy and markets support higher stock prices they load up on growth stocks.
Conversely, if their data suggests a weakening economy they flip – moving out of growth stocks and into the relative safety of consumer staples.
This ratio is a leading indicator of what’s coming.
So what have we been seeing from the is ratio? A warning sign.
Staples have been outperforming growth since November of last year.
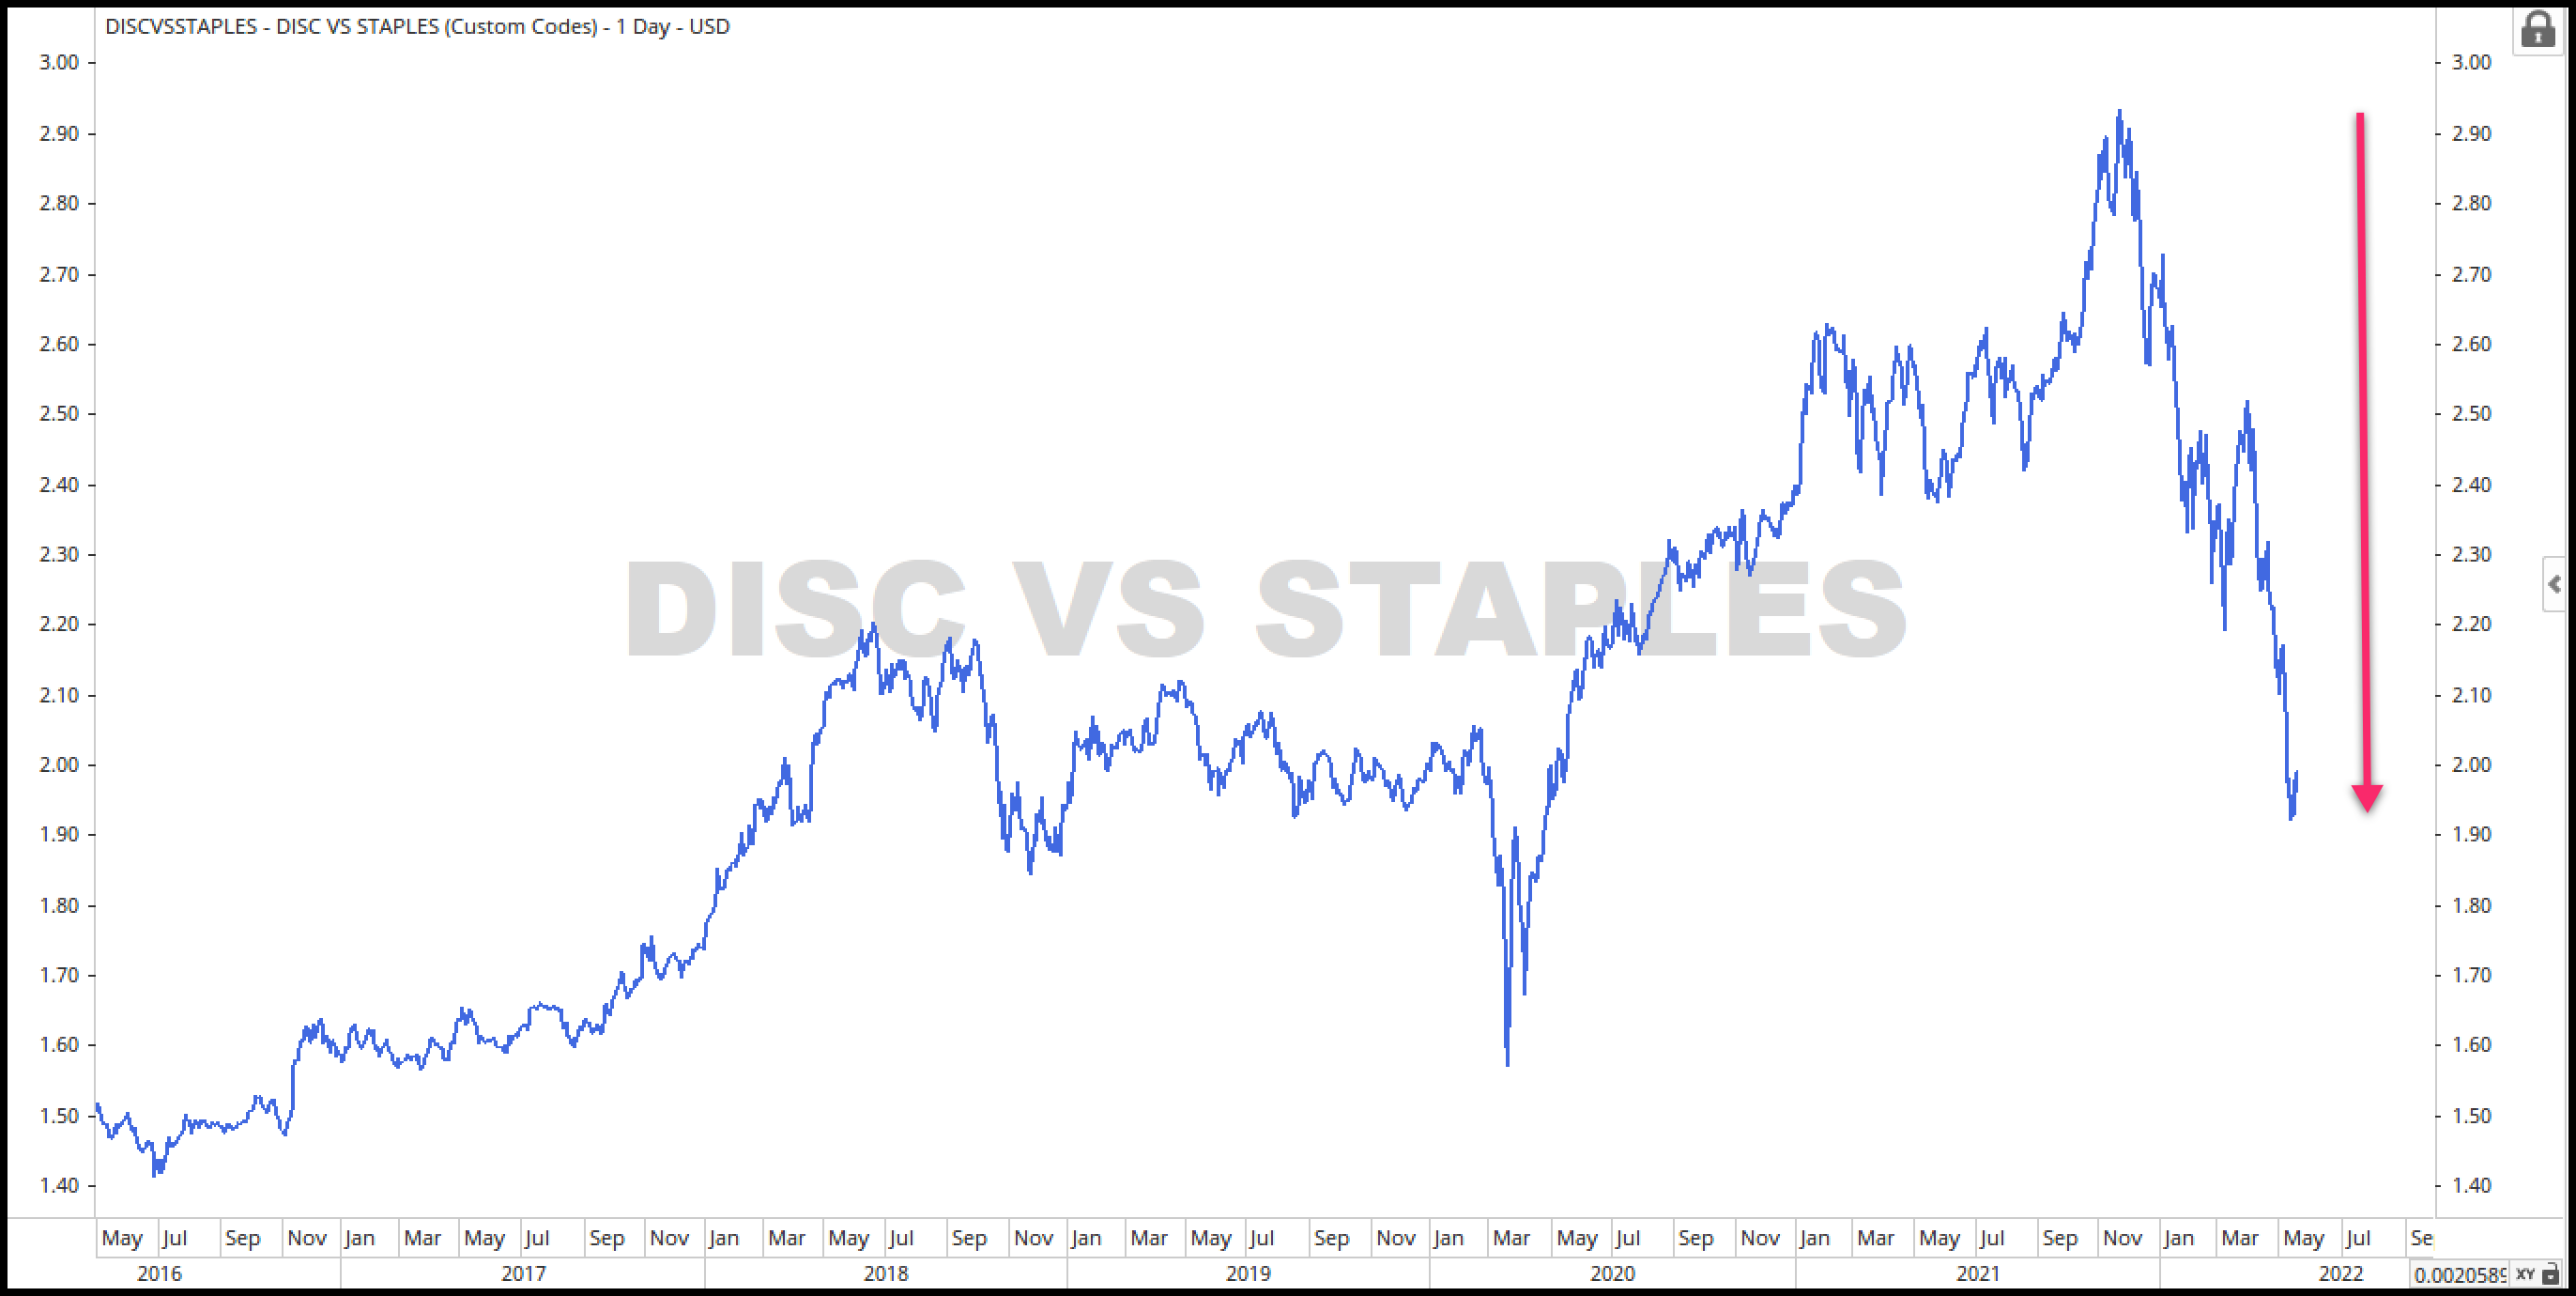
That’s about the same time the DJIA, the S&P 500 index, and the NASDAQ all peaked.
Coincidence? I think not.
Everything I’m reviewing here is price-driven – it’s not opinion and I have no bias.
I don’t care if stocks are moving up or moving down – I care about our ability to recognize the change and act accordingly.
This is a market best suited to preserve your capital – not to be a hero and look for the next homerun. That kind of thinking can leave you mumbling to yourself in the corner.
This is not the same market you have been investing in for the last 10 years. The rules have changed.
This market continues to prove itself to be one that calls for selling the rallies vs. buying the dips. I said earlier we’re not calling tops – or in this case a bottom.
We don’t know for sure when stocks will reverse and when we’ll see sustained rallies and a legitimate bottom will be in.
But what we do know is this: We can’t see higher prices until we stop seeing new lows in price. And we’re not there yet.
A textbook bottom calls for capitulation… when everything gets sold – the good, the bad, and everything in between. When no stock is immune and no sector is safe.
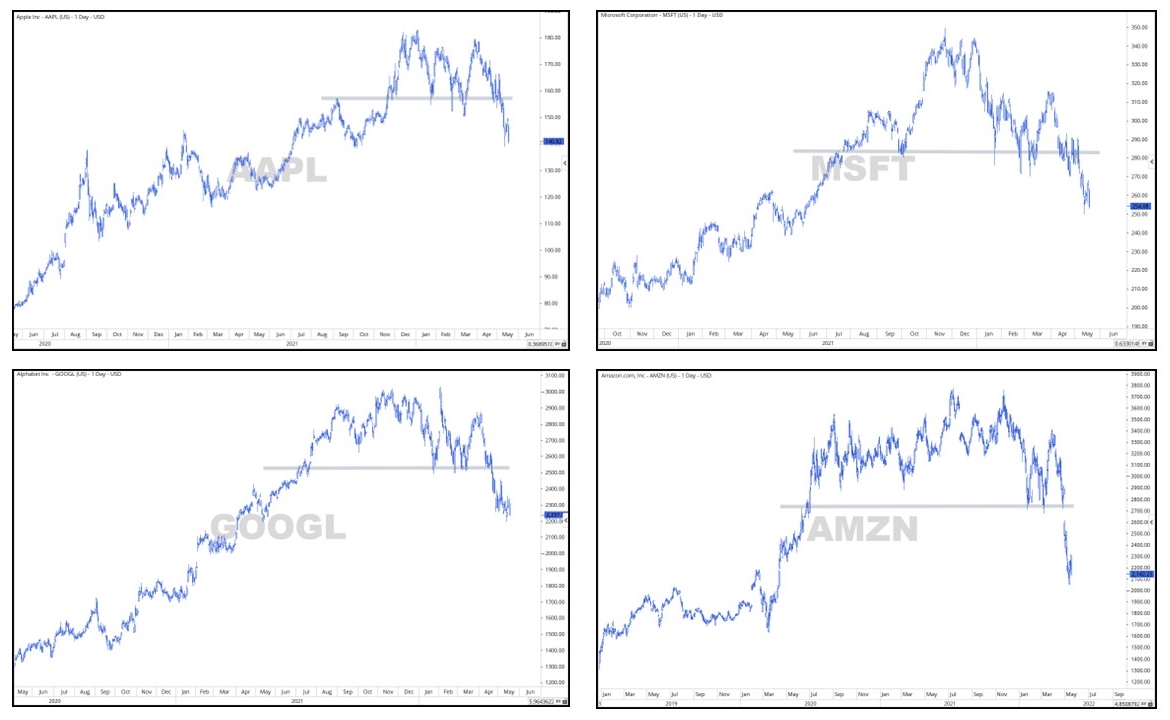
We’re seeing some signs of investor capitulation as some of the biggest stocks in the world have formed major topping patterns and now sit at their lowest levels in over a year.
And yesterday, some of the big-box retailers like Walmart and Target got slammed as inflation is beginning to impact consumer buying decisions.
So what’s left? Energy. And the sector looks to be the last man standing, which is typical late-cycle behavior.
Back in 2007–2008, Consumer Discretionaries and especially Financials peaked well before the S&P 500 which peaked later that year (10/2007).
But it wasn’t until the summer of 2008, that Energy finally made its top. Energy was the last one to fall.
I was talking with Tim Fortier, who also writes for us here at Rowe Wealth and does a ton of deep-dive researching, that he is seeing big buyers of put options in the Energy stocks.
And other data points to possible price divergences between the Energy sector and Oil Services and Explorers & Producers.
So are cracks beginning to emerge in Energy strength? Will that be next? We’ll see.
Will that signal the bottom? We simply don’t know.
We do know that most of our research points to continued market weakness and elevated risk to investors. And as long as the weight of the evidence suggests there’s more risk than opportunity then we’ll remain cautious.
Let’s think for a minute about the challenges for future growth – challenges that many investors have not faced in decades, if ever.
Inflation is at 40-year highs and the Fed is raising interest rates and intends to reduce liquidity in the markets.
The challenge for the Fed is they can either stimulate the economy to avoid a possible recession or they can fight to tame inflation – but they can’t do both.
It’s pick-your-poison for the market – recession or inflation.
It feels like a lose-lose proposition to me.
Russia’s invasion of Ukraine is causing a slowdown of economic growth throughout all of Europe that may result in a recession.
China and its zero-covid policy is causing its own economy to implode and the shutdown of factors and the largest seaport in the world will only serve to exacerbate the supply chain challenges the world faces today.
If you have any questions or have been considering hiring an advisor, then schedule a free consultation with one of our advisors today. There’s no risk or obligation—let's just talk.
Tags

Free Guide: How to Find the Best Advisor for You
Get our absolutely free guide that covers different types of advisory services you'll encounter, differences between RIAs and broker-dealers, questions you’ll want to ask when interviewing advisors, and data any good financial advisor should know about you and your portfolio.
