
Related Blogs
June 20, 2022 | Avalon Team
On Wednesday, the Federal Reserve raised its short-term interest rate by three-quarters of a percentage point. It’s the largest hike since 1994.
Federal Reserve Chair Jerome Powell and other board members seem determined to reach their 2% inflation target and are concerned about falling behind in their fight against inflation.
Perhaps Captain Obvious needs to explain to this esteemed bunch that they ALREADY ARE way behind… and not by just a little.
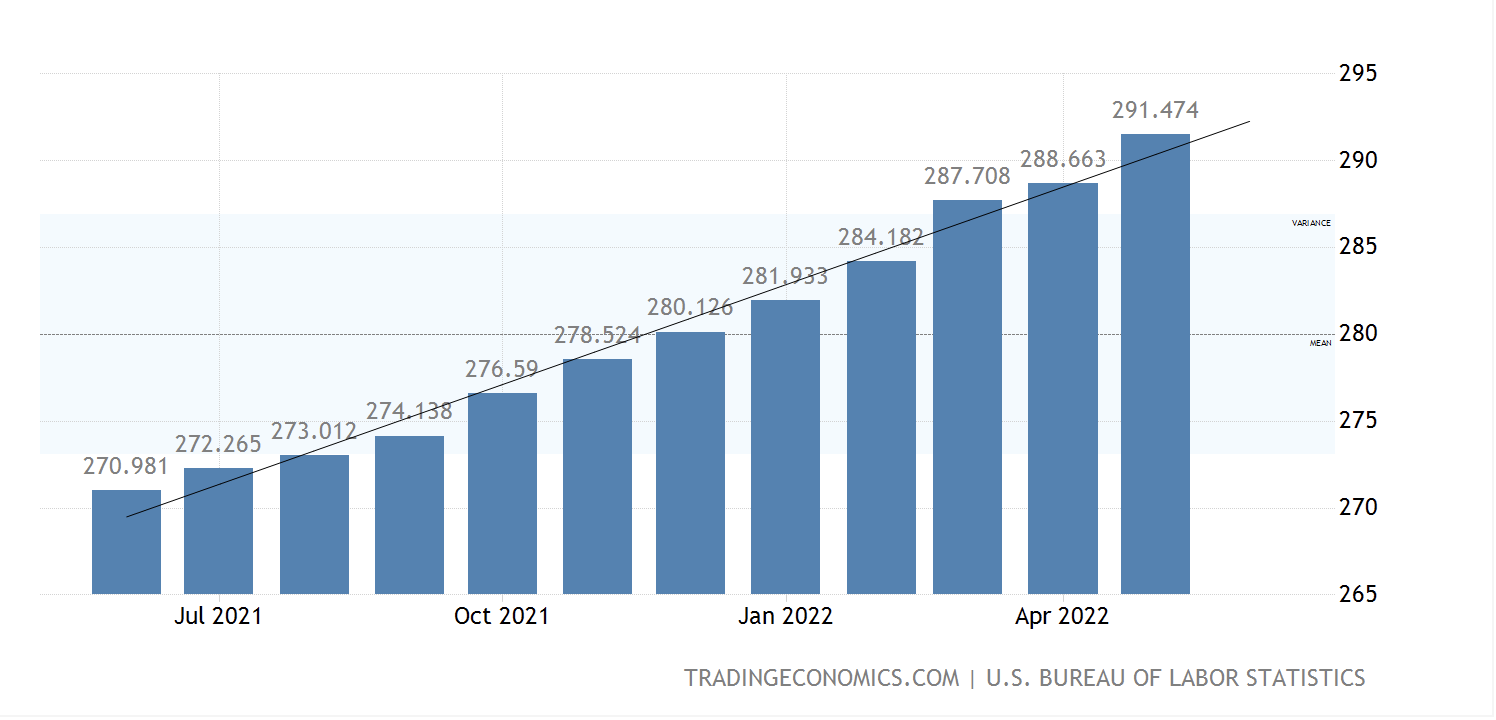
It was reported last Friday that the consumer price index in the U.S. hit 291.5 points bringing the annual inflation rate to 8.6% in May of 2022, the highest since December of 1981 and compared to market forecasts of 8.3%.
So now the Fed is attempting to play “catch up” by raising rates first at 0.25%, then 0.5%, and now 0.75%. As I write this, the Fed has rates between 1.5% and 1.75%.
Meanwhile, inflation is over 8%. And the yield on the 2-Year U.S. Treasury, which the Fed usually uses as a guide for where rates should be, is at 3.2%.
The Fed is nowhere even close!
Powell did his best to soft-pedal the increase in rates and suggested we could get to the fantasy soft-landing.
I don’t see that happening.
Increasing interest rates means that the cost of money for mortgages, car loans, credit cards, and home equity loans is also going up.
Let’s start by looking at mortgages.
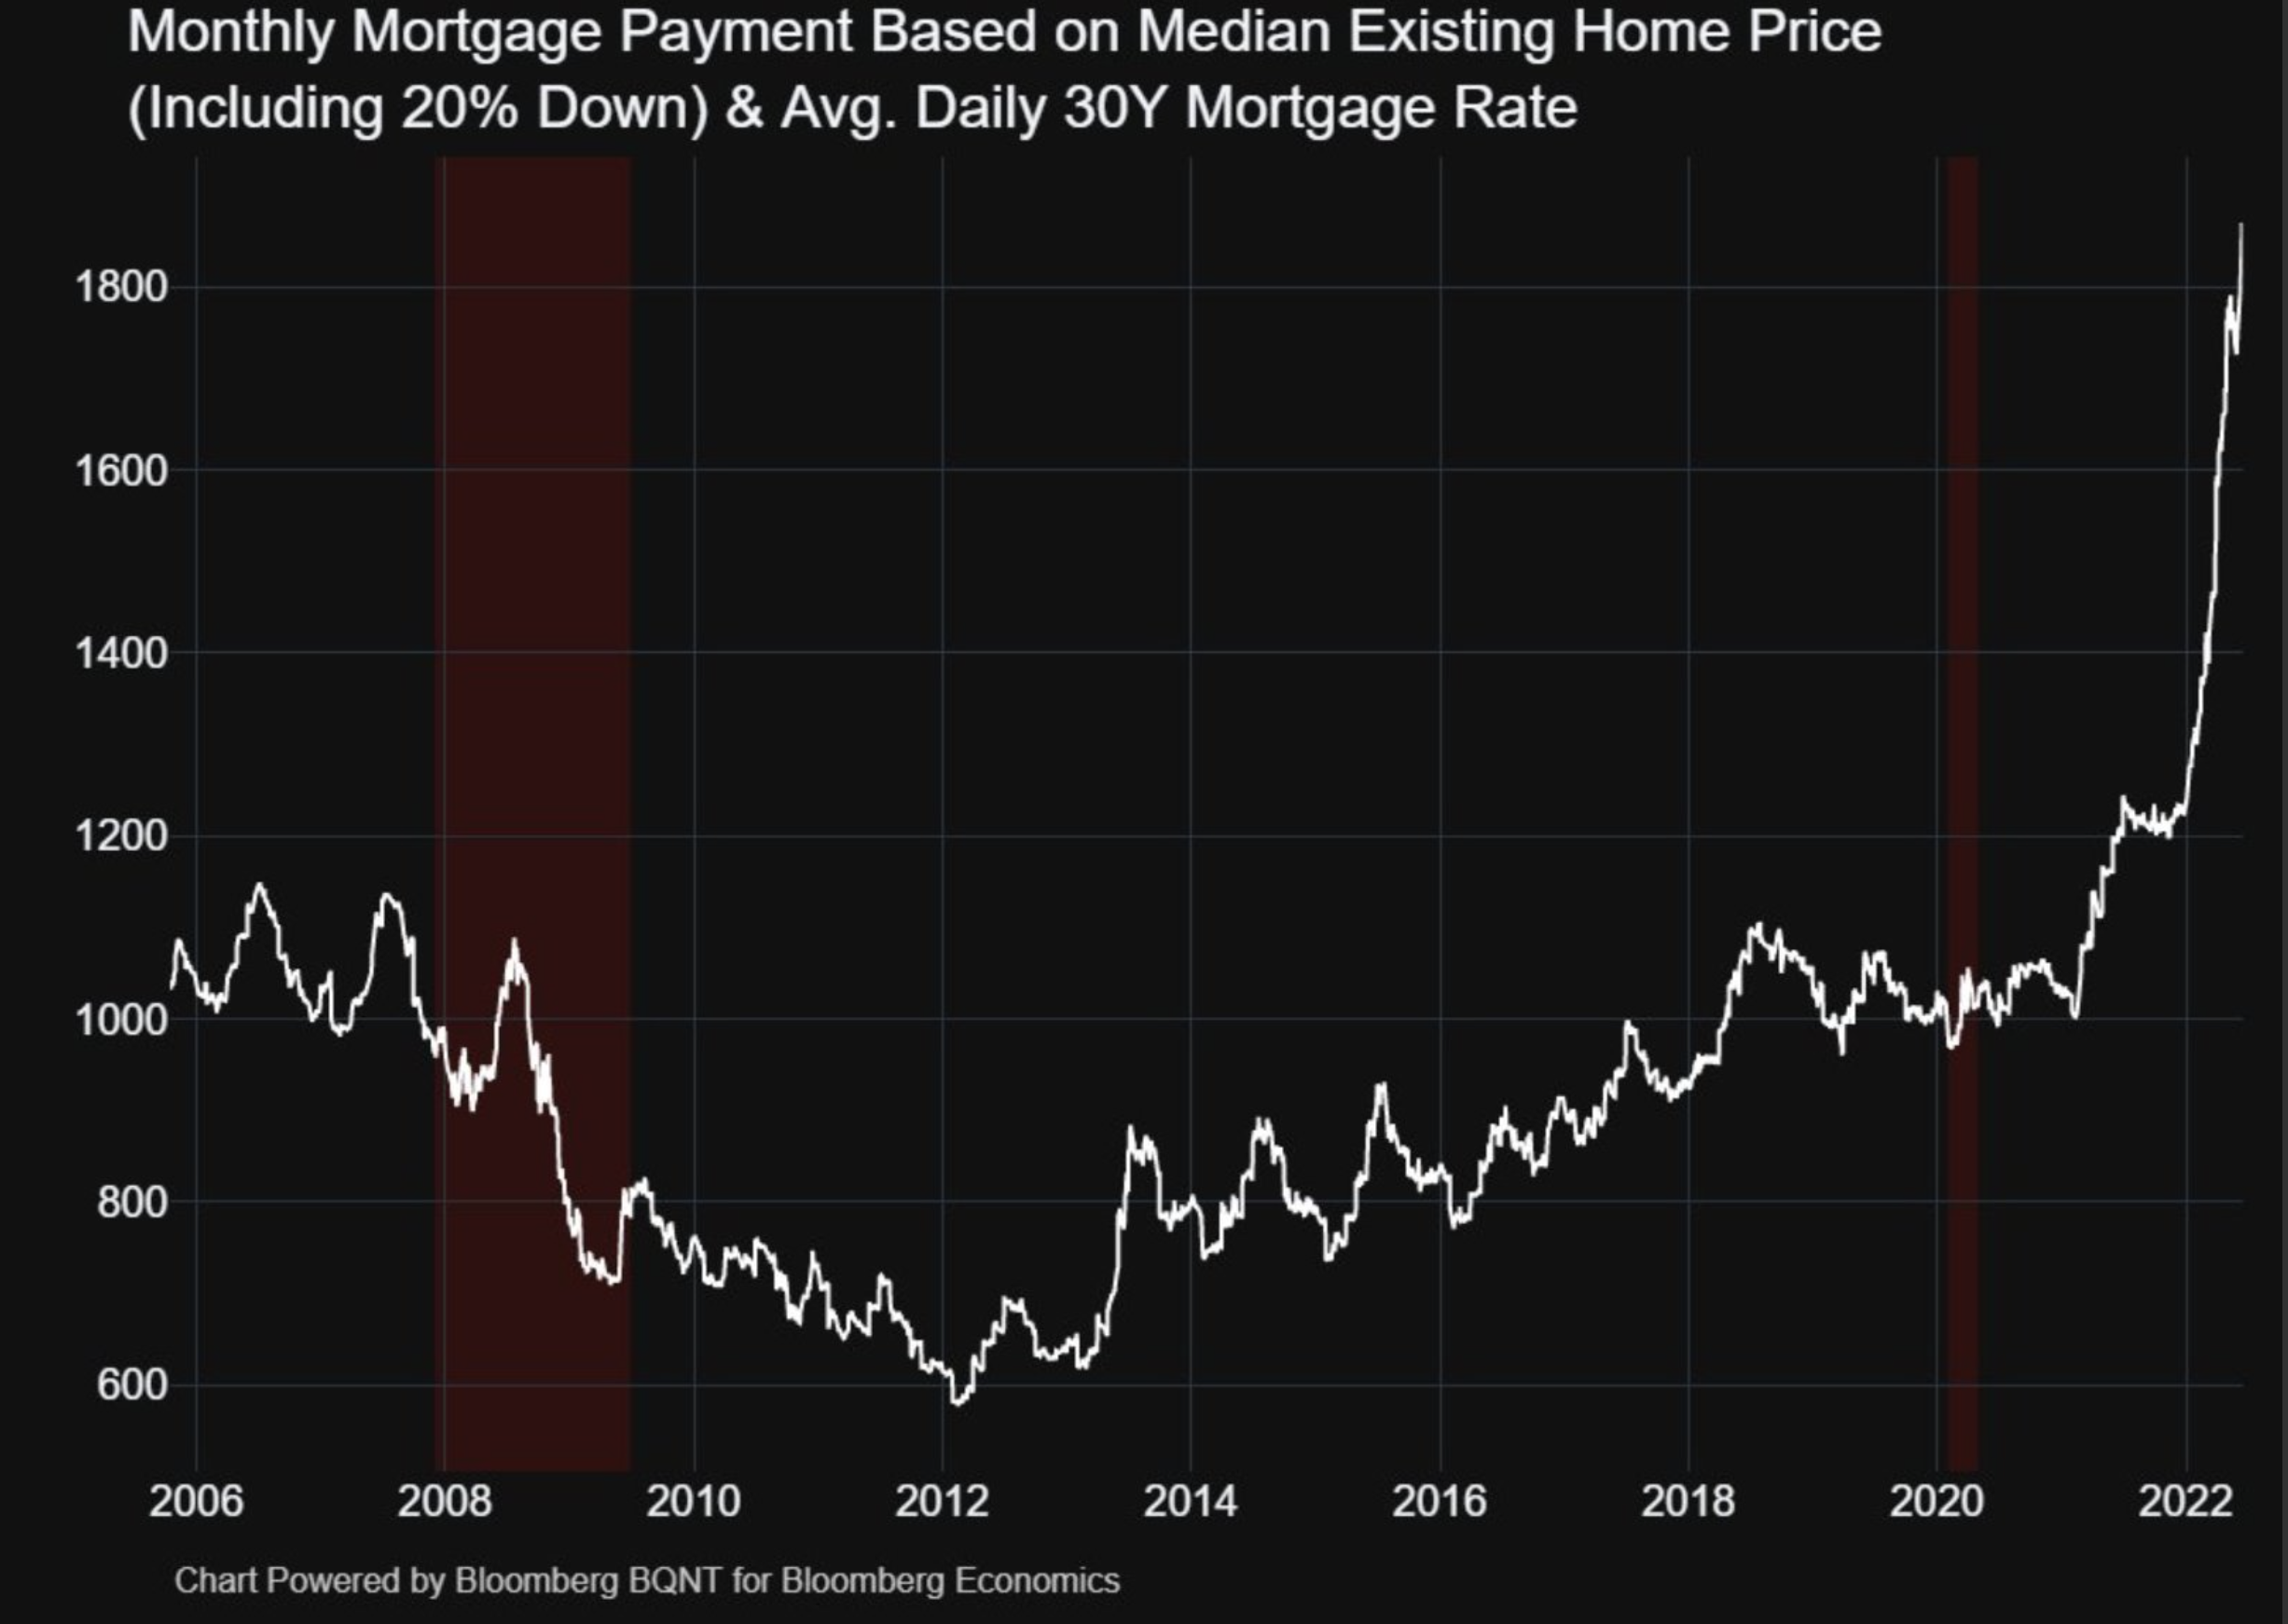
See the problem?
Homes are becoming unaffordable.
In the words of fund manager Kyle Bass:
“Financial conditions are tightening at lightning speed, over $33 trillion of equity declines, $2T of crypto losses, largest bond market losses in history, and FED balance sheet withdrawal of almost $100 billion of risk assets each month just beginning. The University of Michigan Consumer Confidence at 70-yr lows… A hard landing is assured.”
I have said this before and I will say it again. There is no way that the FED will move rates to where they would need to be to get ahead of inflation. You don’t have to worry about Powell turning into a Paul Volcker.
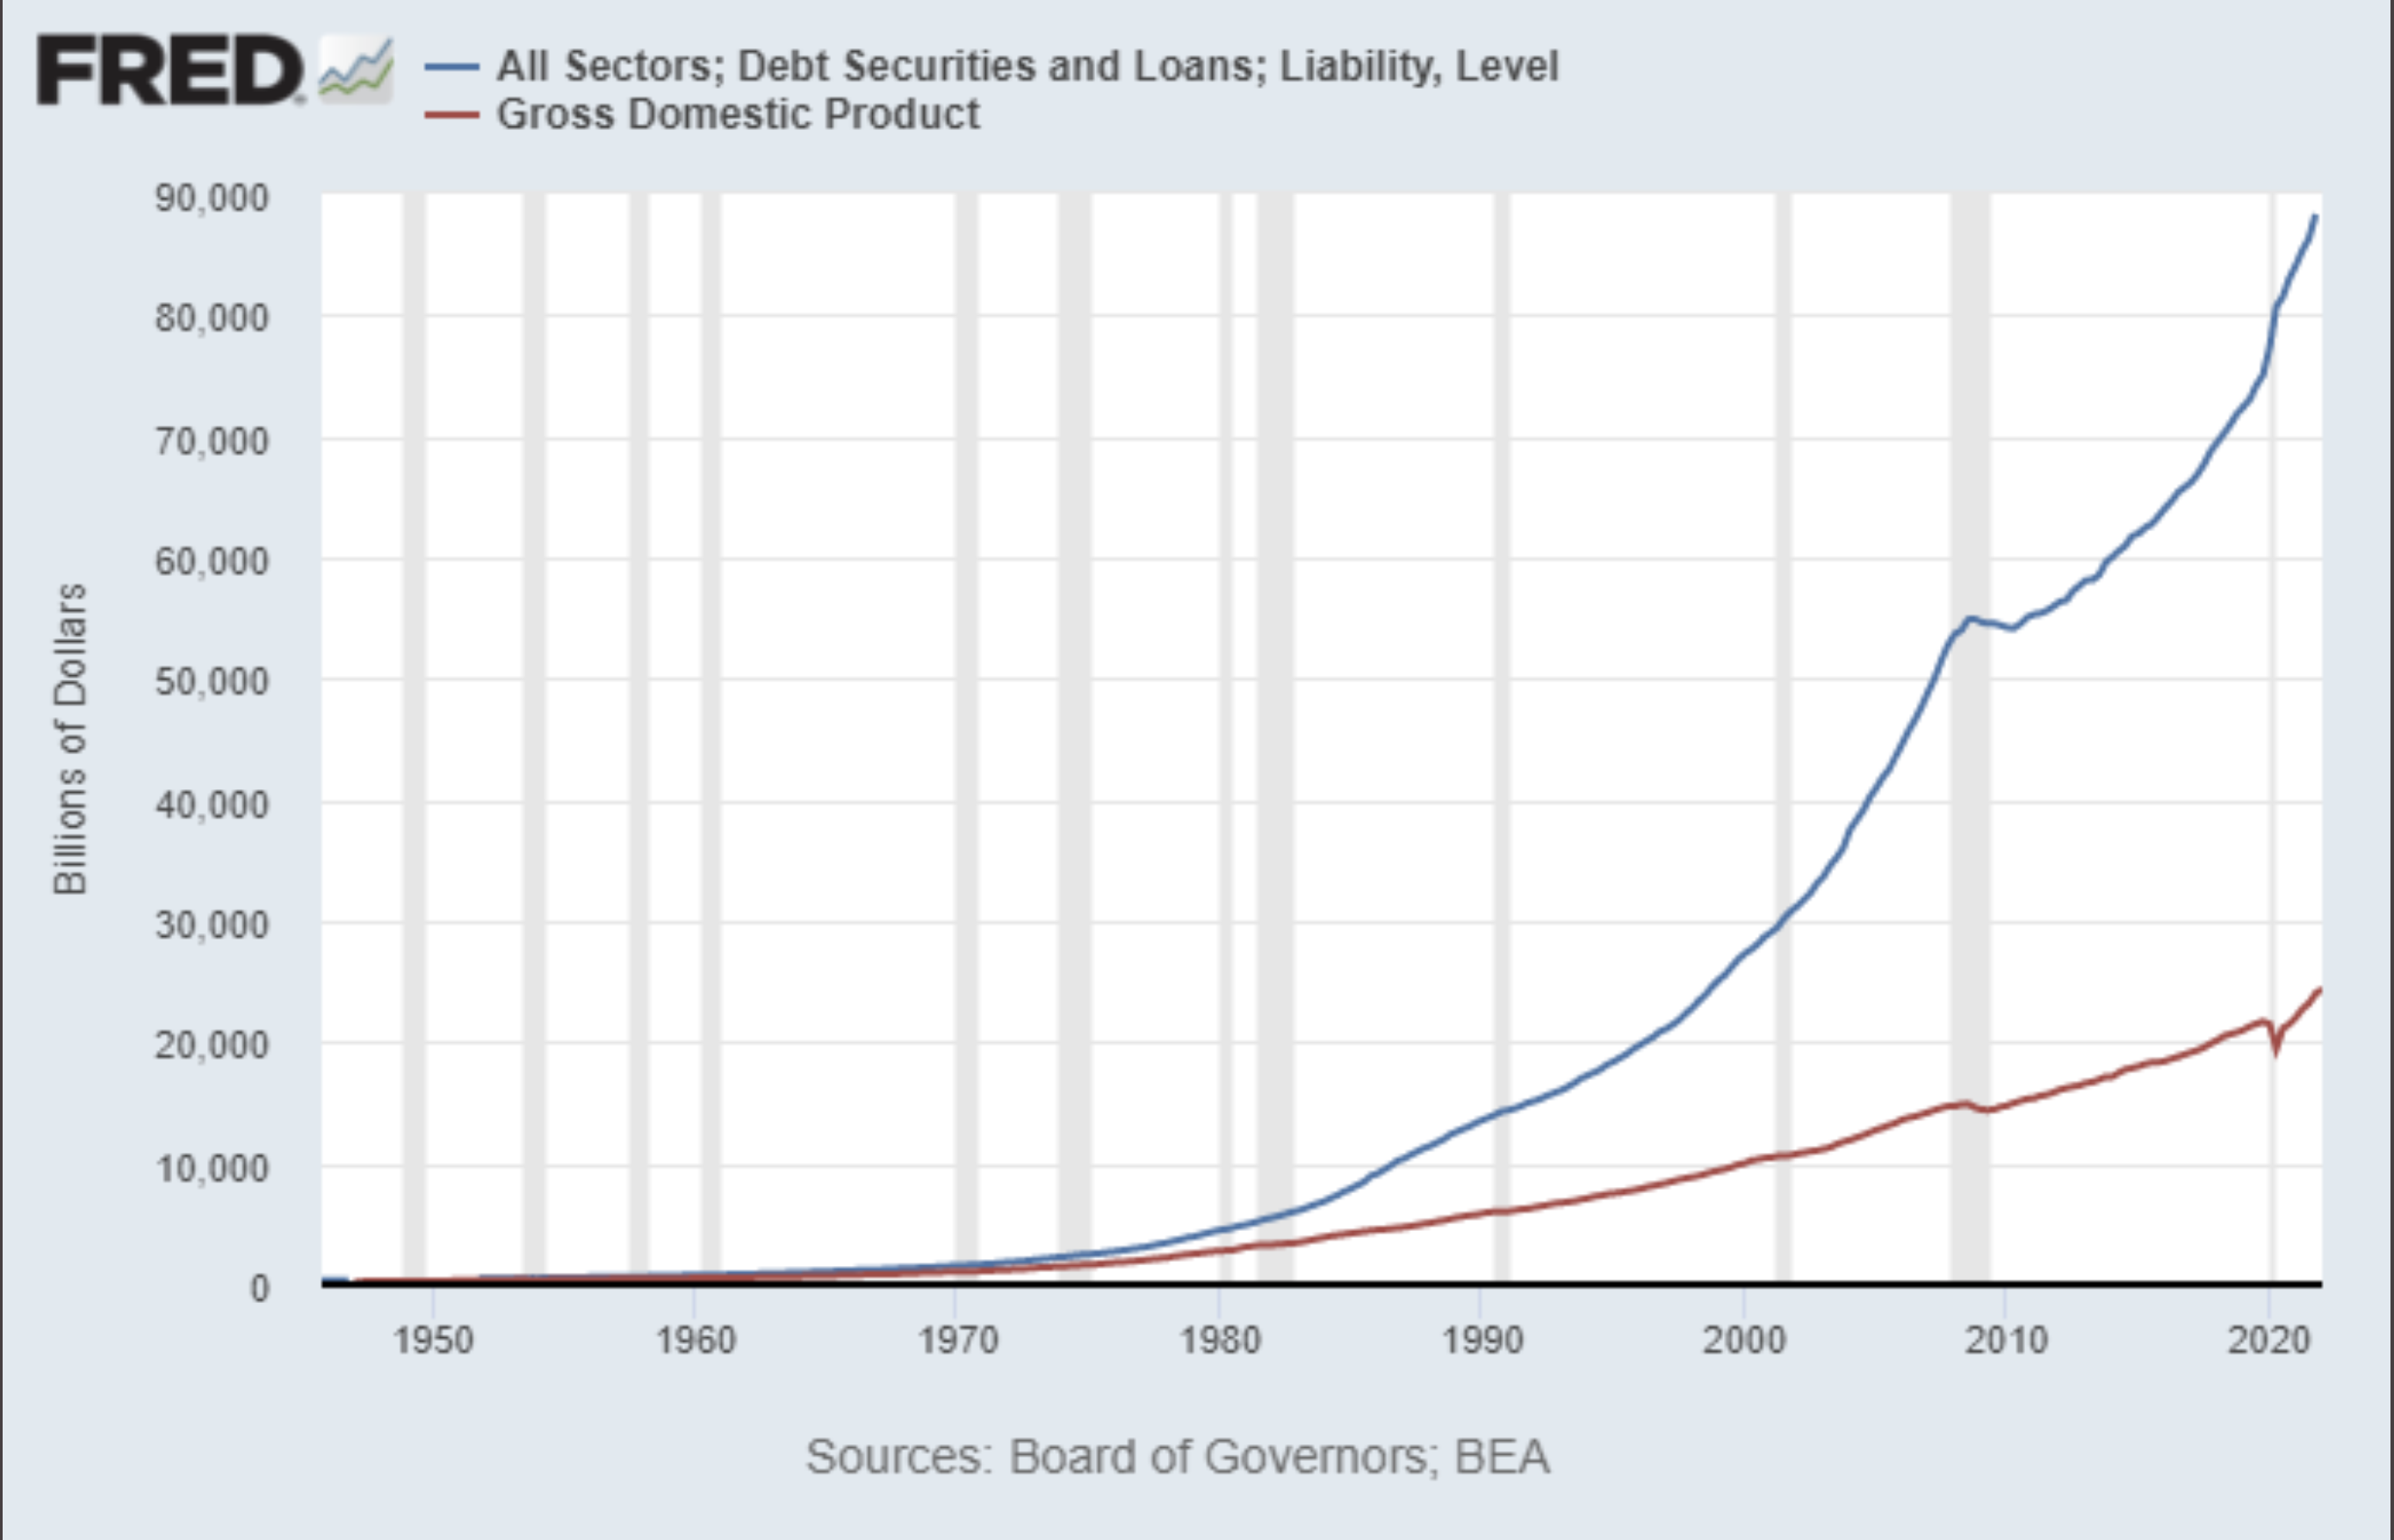
Check out the chart above – the red line produces the interest payments on the debt of the blue line. Now, when rates are zero, the blue line can rise without any material consequences as the cost to service debt remains the same even though the amount of debt has increased.
The problem arises when inflation rears its ugly head pushing the cost of money higher as well. As interest rates increase, so does the cost of the interest carry.
Currently, the Federal government is running a $30T deficit. A 1% increase in the cost of money means another $300B is added to the deficit… on top of the expected projected $2B deficit spending.
Expectations are that the Fed will raise rates by a half-point on September 21, and then four more quarter-point federal fund rate increases at the four meetings after that.
I will be surprised if they can get that far without a major market event occurring first.
So far, stocks have fallen by over 20% YTD, with technology stocks being hit the hardest, down -32% as measured by the QQQs.
Technology stocks are especially vulnerable to rising rates.
As the Fed keeps raising interest rates, long-term inflation expectations will decrease strengthening the real yield and consequentially lowering P/E ratio. The contraction in the P/E drives the price lower.
The Nasdaq 100 P/E ratio is now at two-year lows.
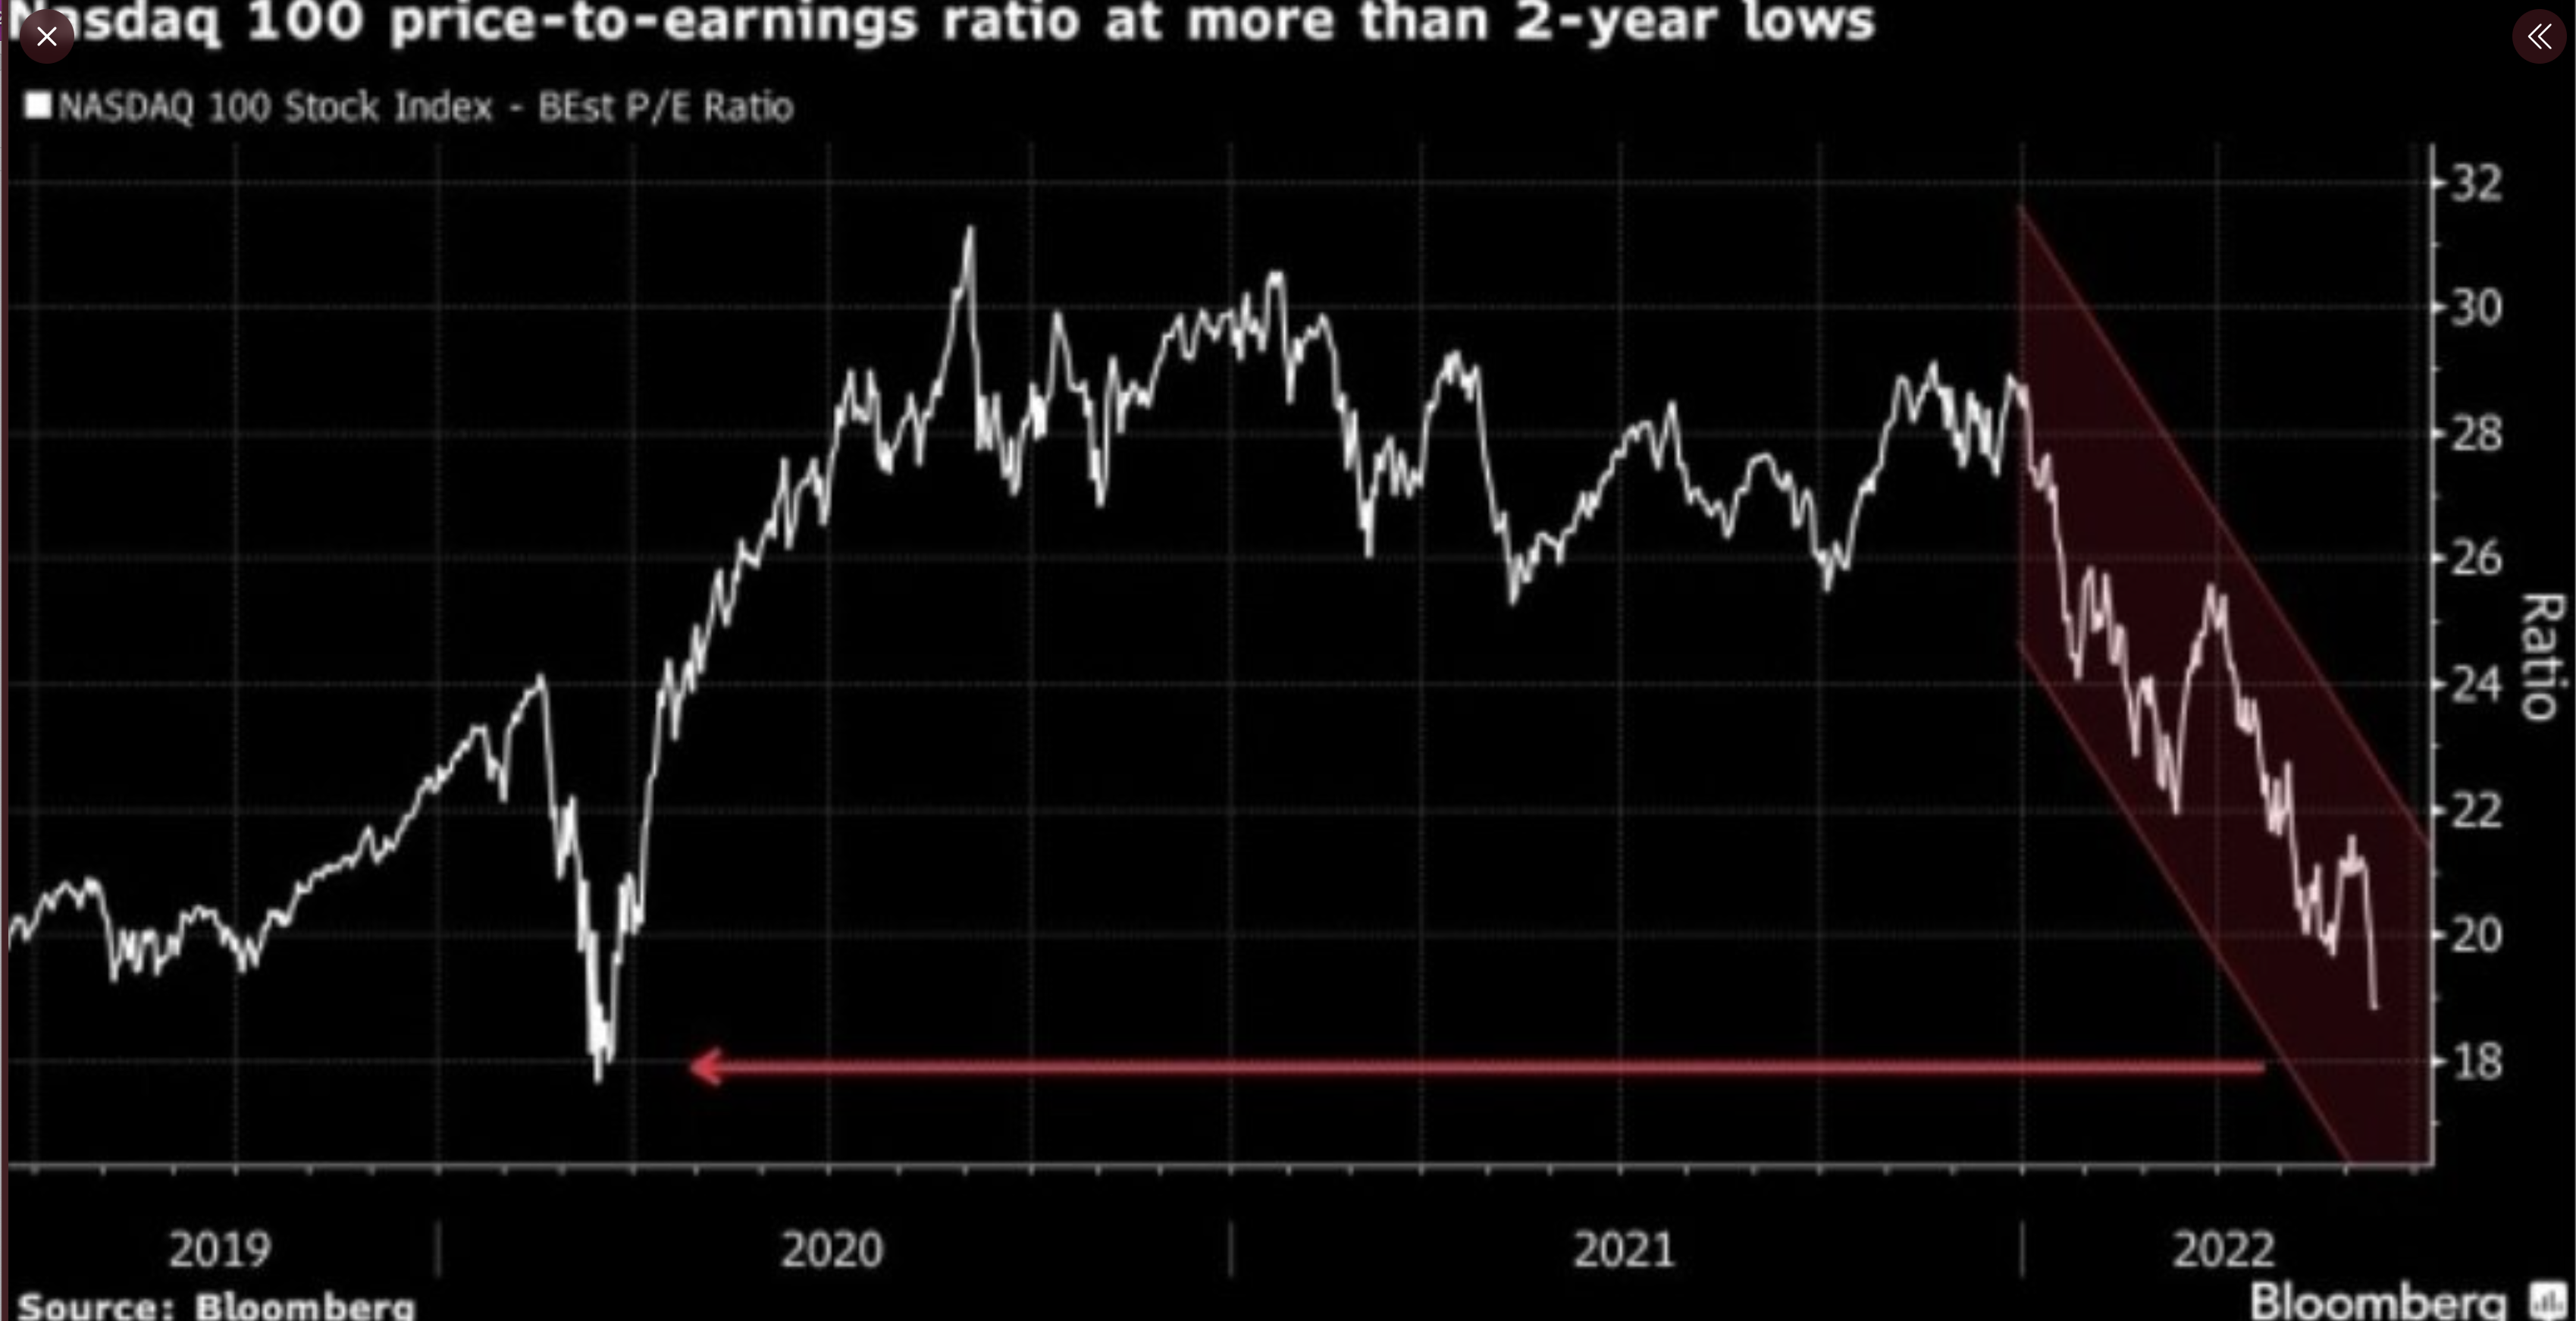
For all those investors who may be tempted to buy the current dip, consider what may happen if the FED does follow through with its promise of more interest rate increases.
It’s not going to be pretty.
Market Update
In my article last week I said “expect volatility to increase.”
Check. We got that.
In just the last five days (as of the close on 6/16), the S&P 500 is down nearly 9%! This included several “long bar days” where the market declined by 3% and 4% or more in just one day. That’s some major volatility and is indicative of the force of selling we have seen in this bear market.
Furthermore, the market selling as of late has been brutal. As noted by BofA:
“More than 90% of stocks in the S&P 500 declined today. It’s the 5th time in the past 7 days. Since 1928, there have been exactly 0 precedents. This is the most overwhelming display of selling in history.”
On a long-term basis, I’m bearish as I think the macro levers of inflation, rising rates, and contracting valuations are trends that have only just begun. But on a shorter-term basis, I’m seeing some things that suggest a bear market rally may be near.
Here is what I am seeing…
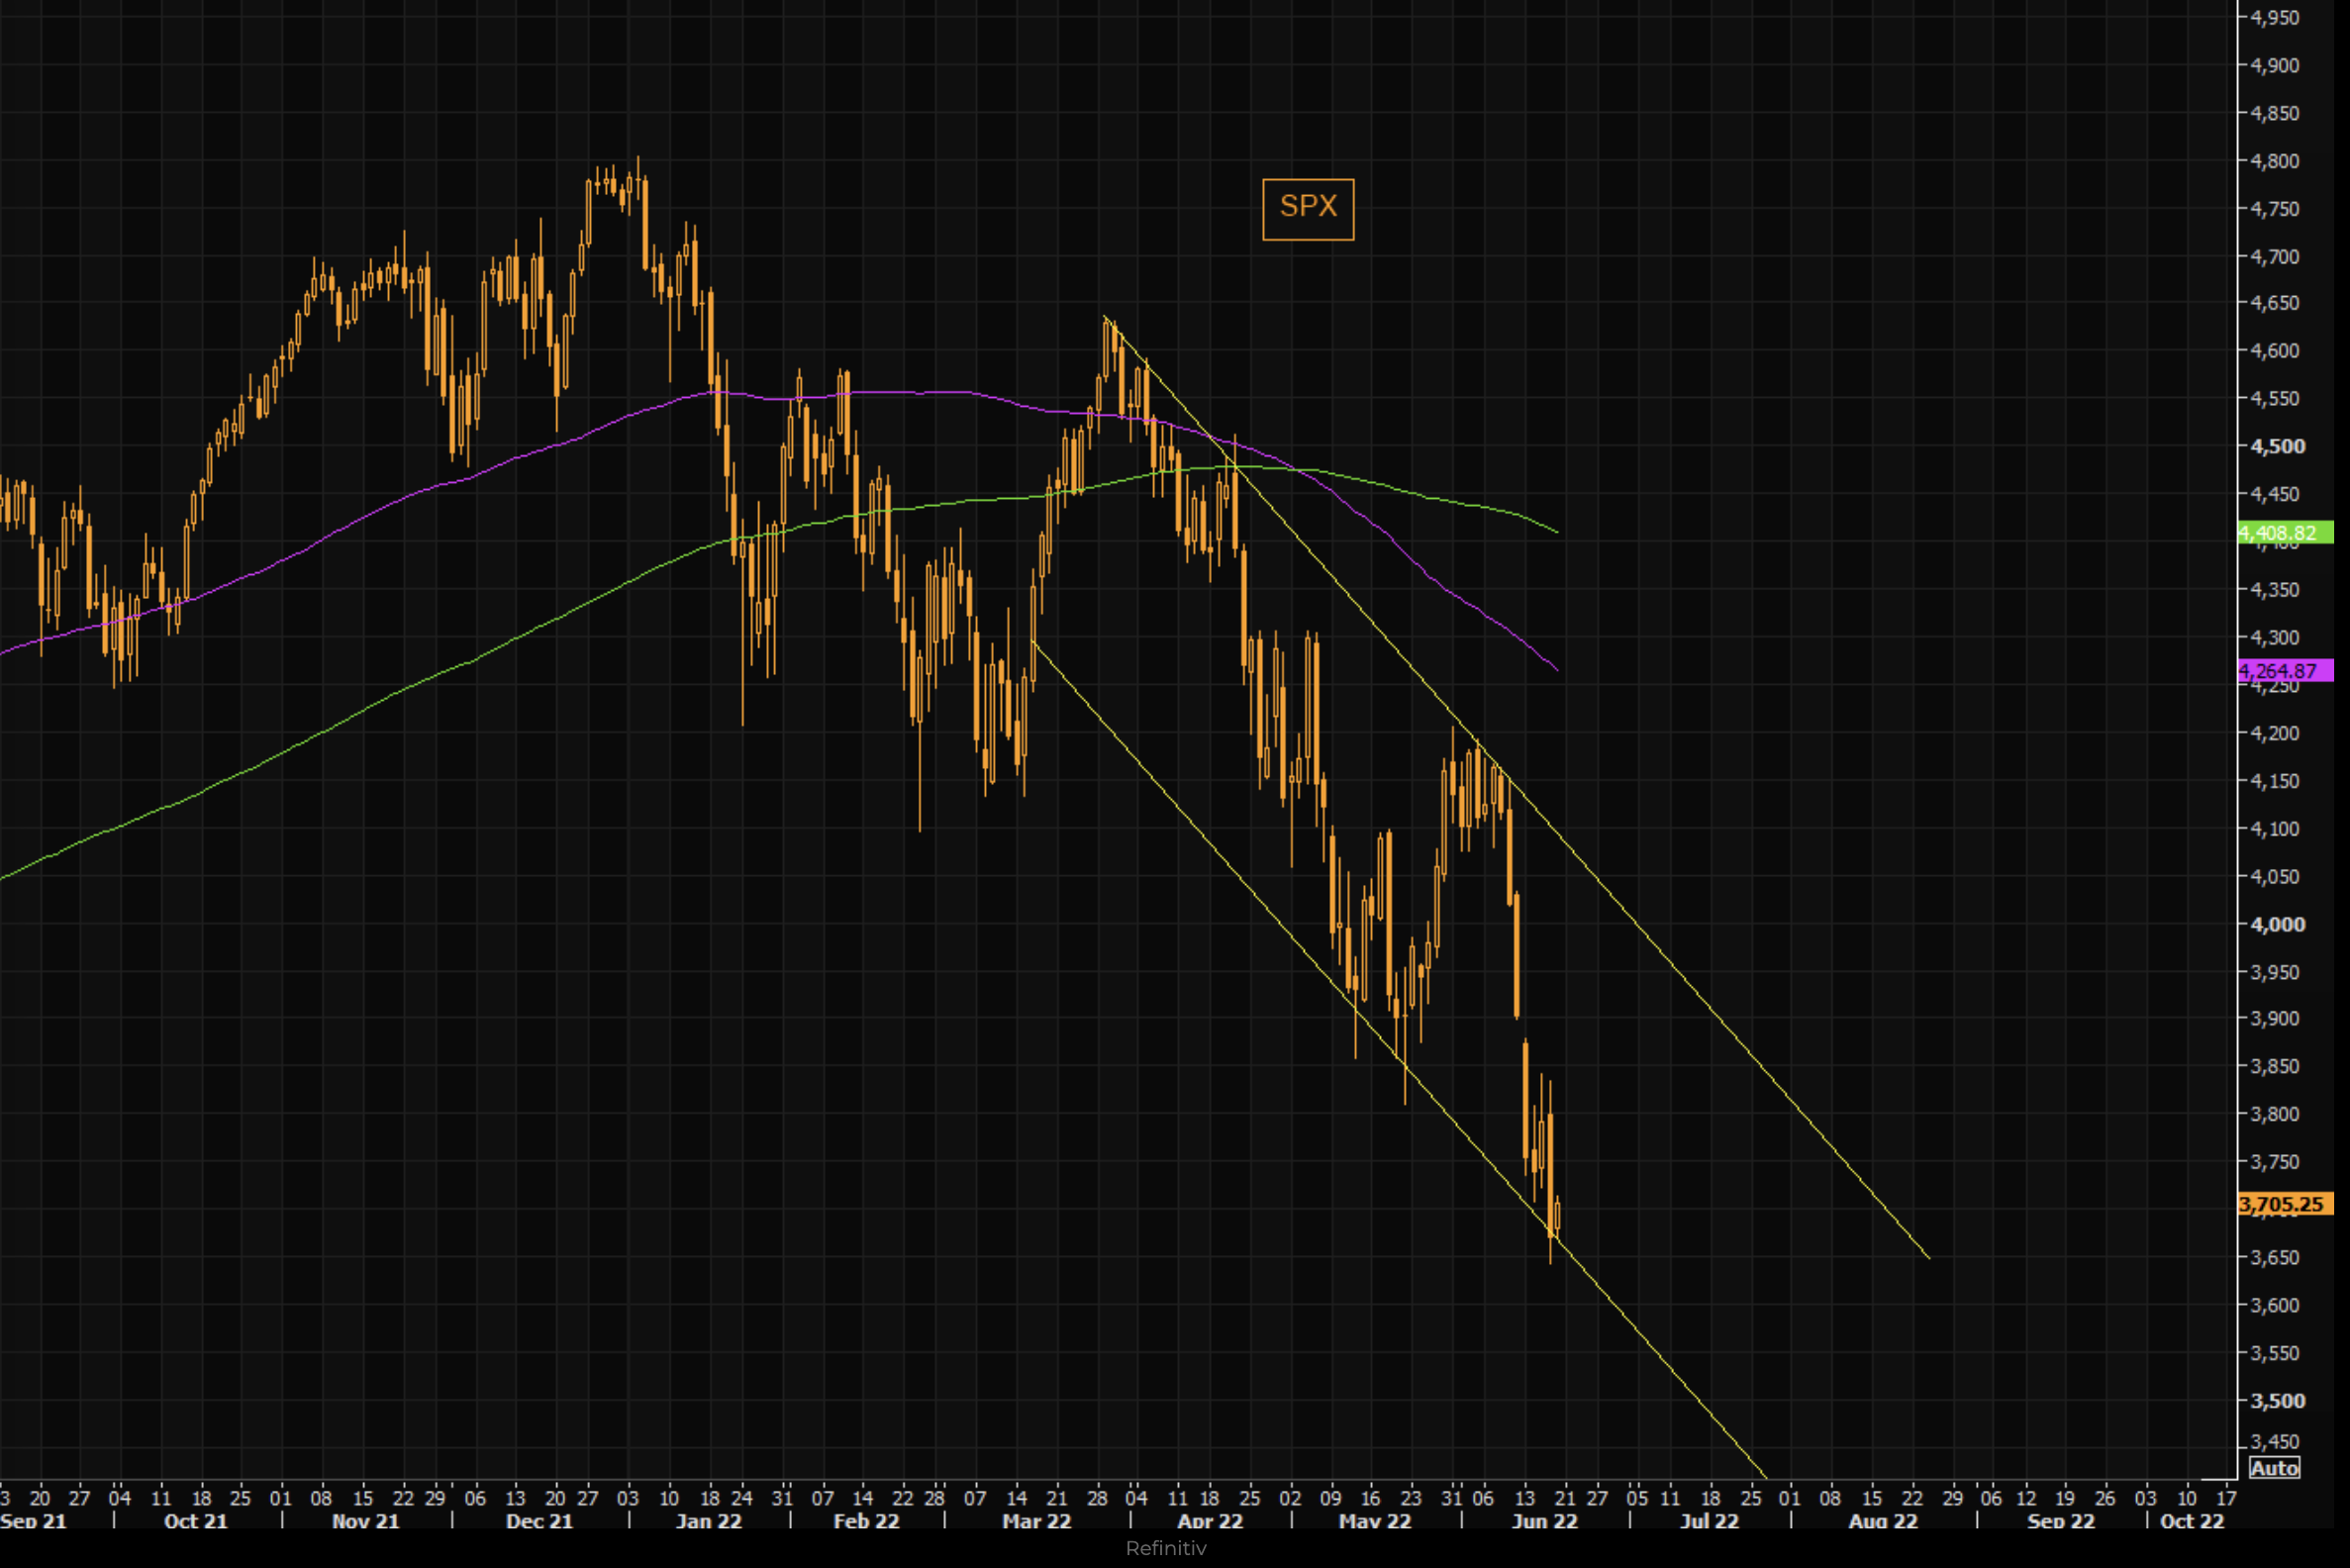
First, the S&P 500 has a clearly defined trend channel starting in March. It has managed reversing at highs and lows inside this channel
So far, shorting the bear market rallies has been the main trade, but the rallies from the bottom of the channel have been significant.
So, number one is the price is currently at a spot where we have seen some nice rallies begin in the past. Number two is that market internals are hitting some extreme levels.
Here are a few examples.
Notice on the chart below that the percentage of stocks trading above their respective 200 DMA, 150 DMA, and 50 DMA is now hitting single-digit percentage levels! We rarely see such levels and only do when the market is establishing a bottom after heavy selling.
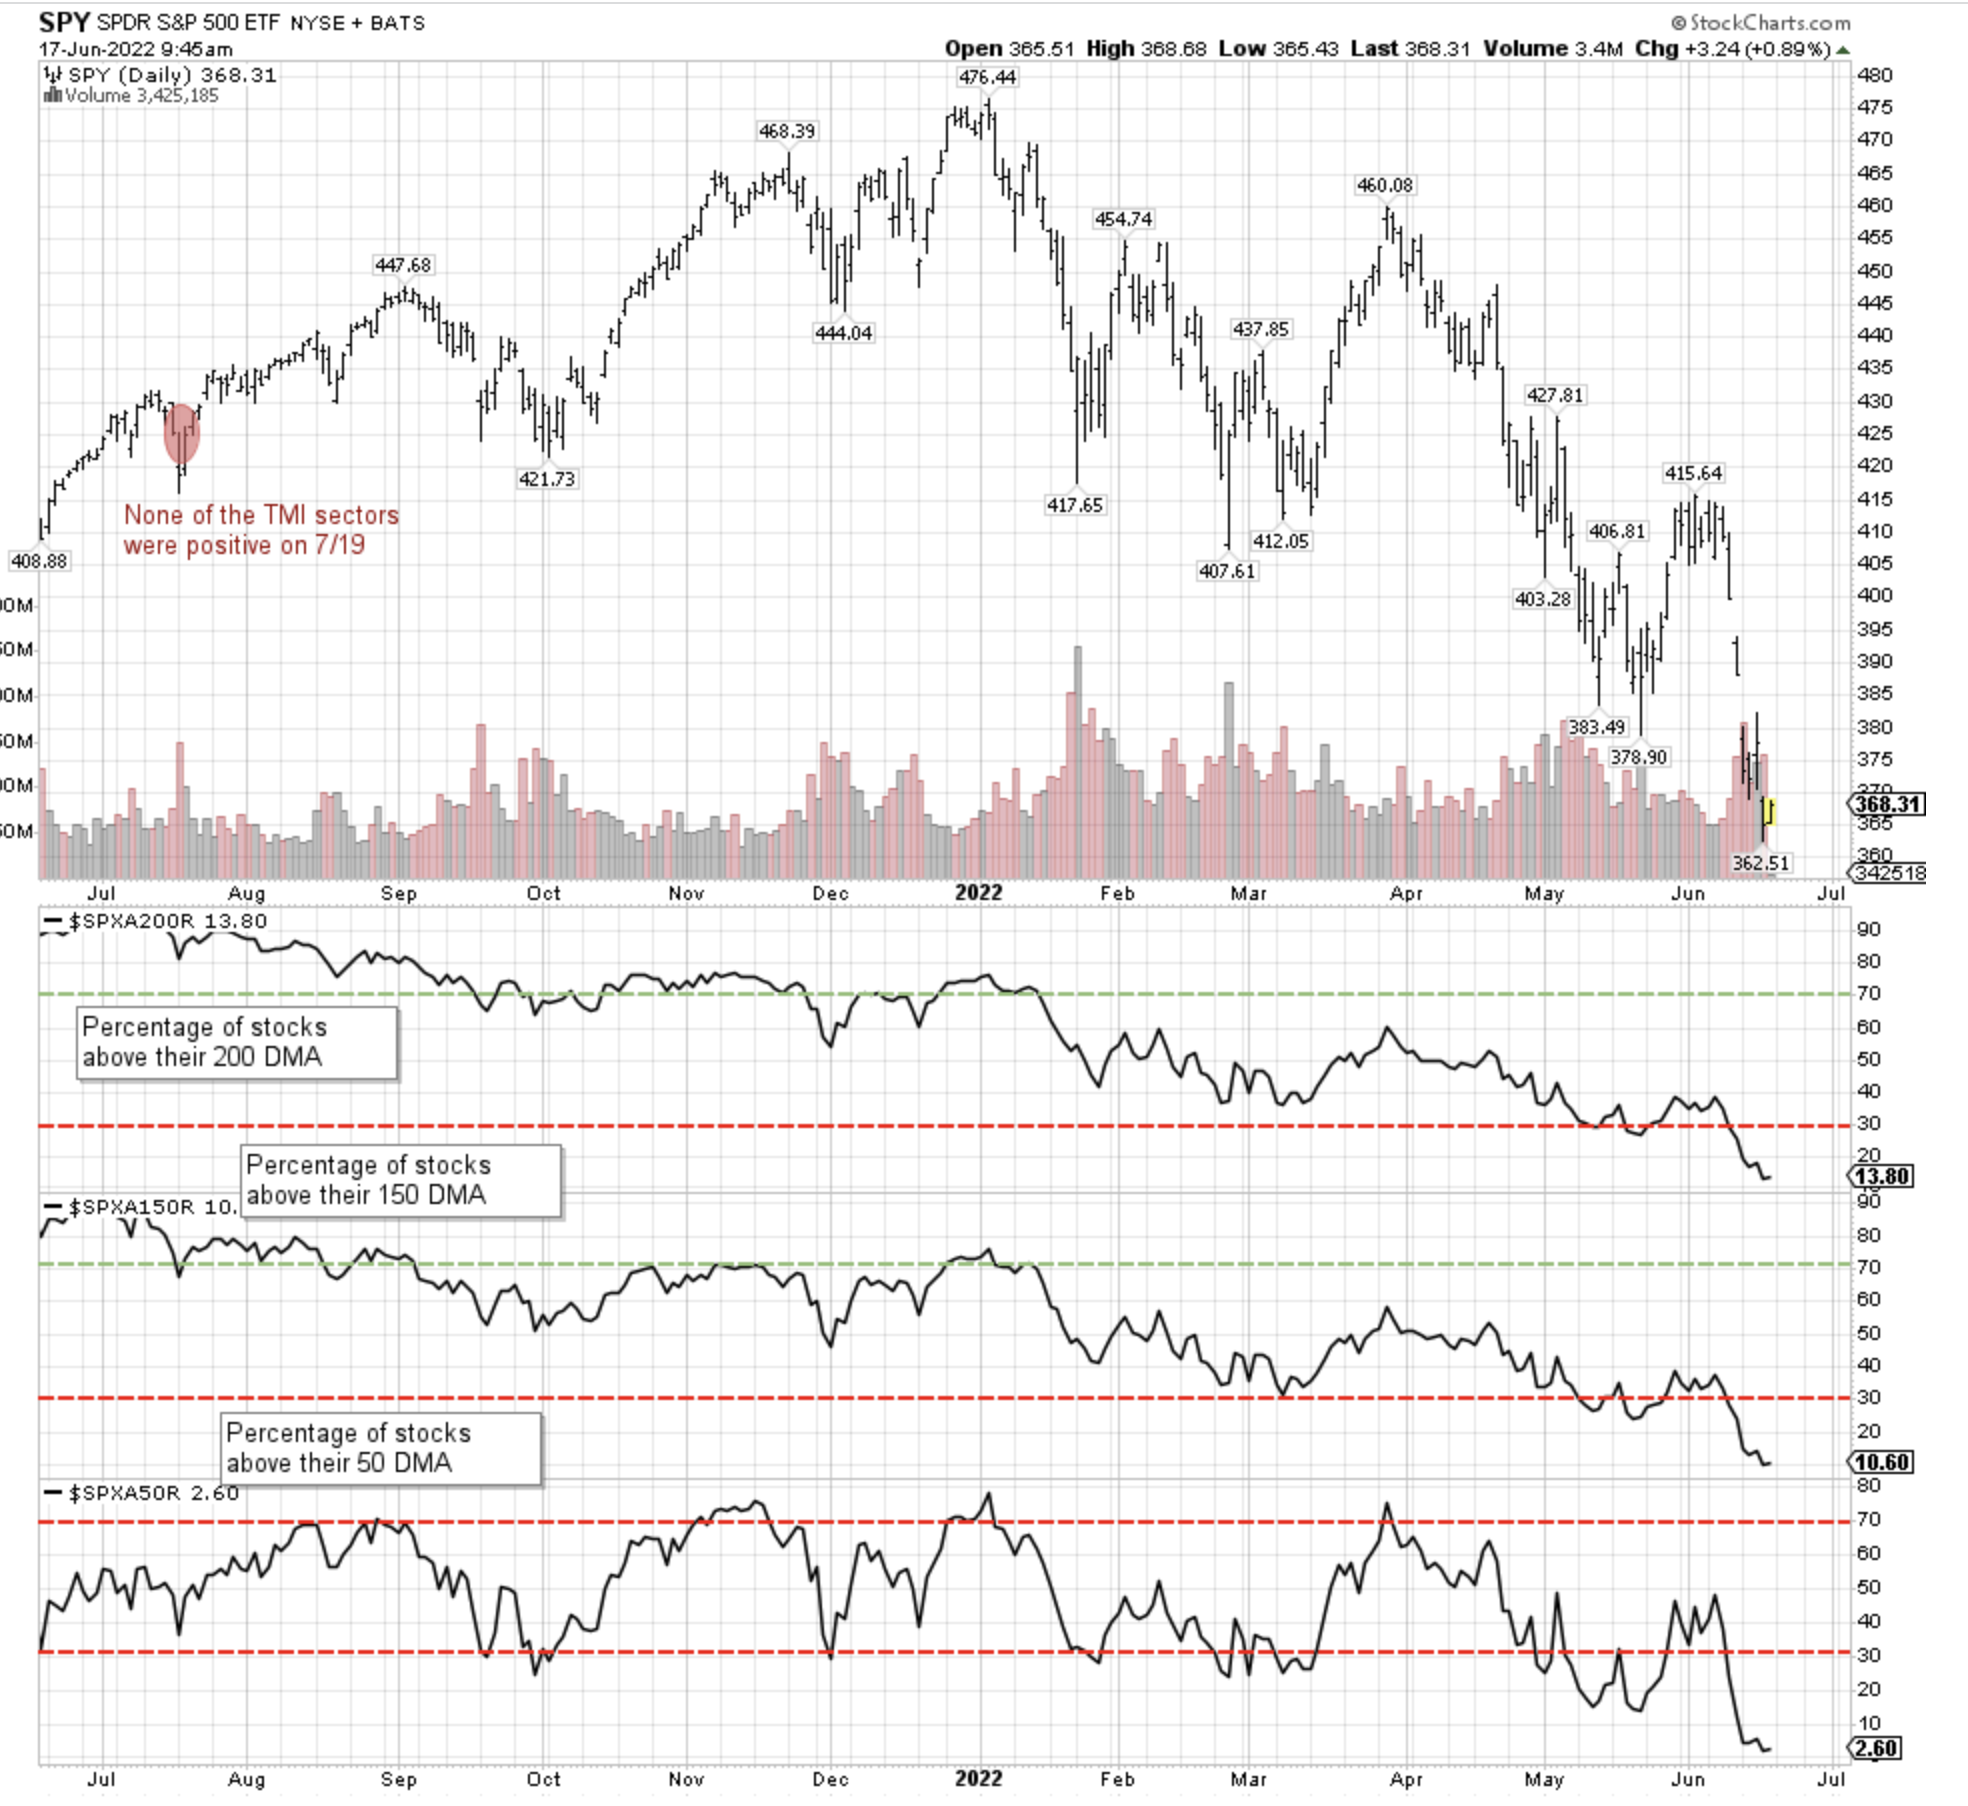
Note that the Percent 50 DMA is 2.2%. The last time we saw such a low reading was at the March 2020 lows after the Covid crash.
The selling has done a good job of creating fear, which has caused investors to aggressively buy puts, demonstrated in the Put/Call ratio shown below.
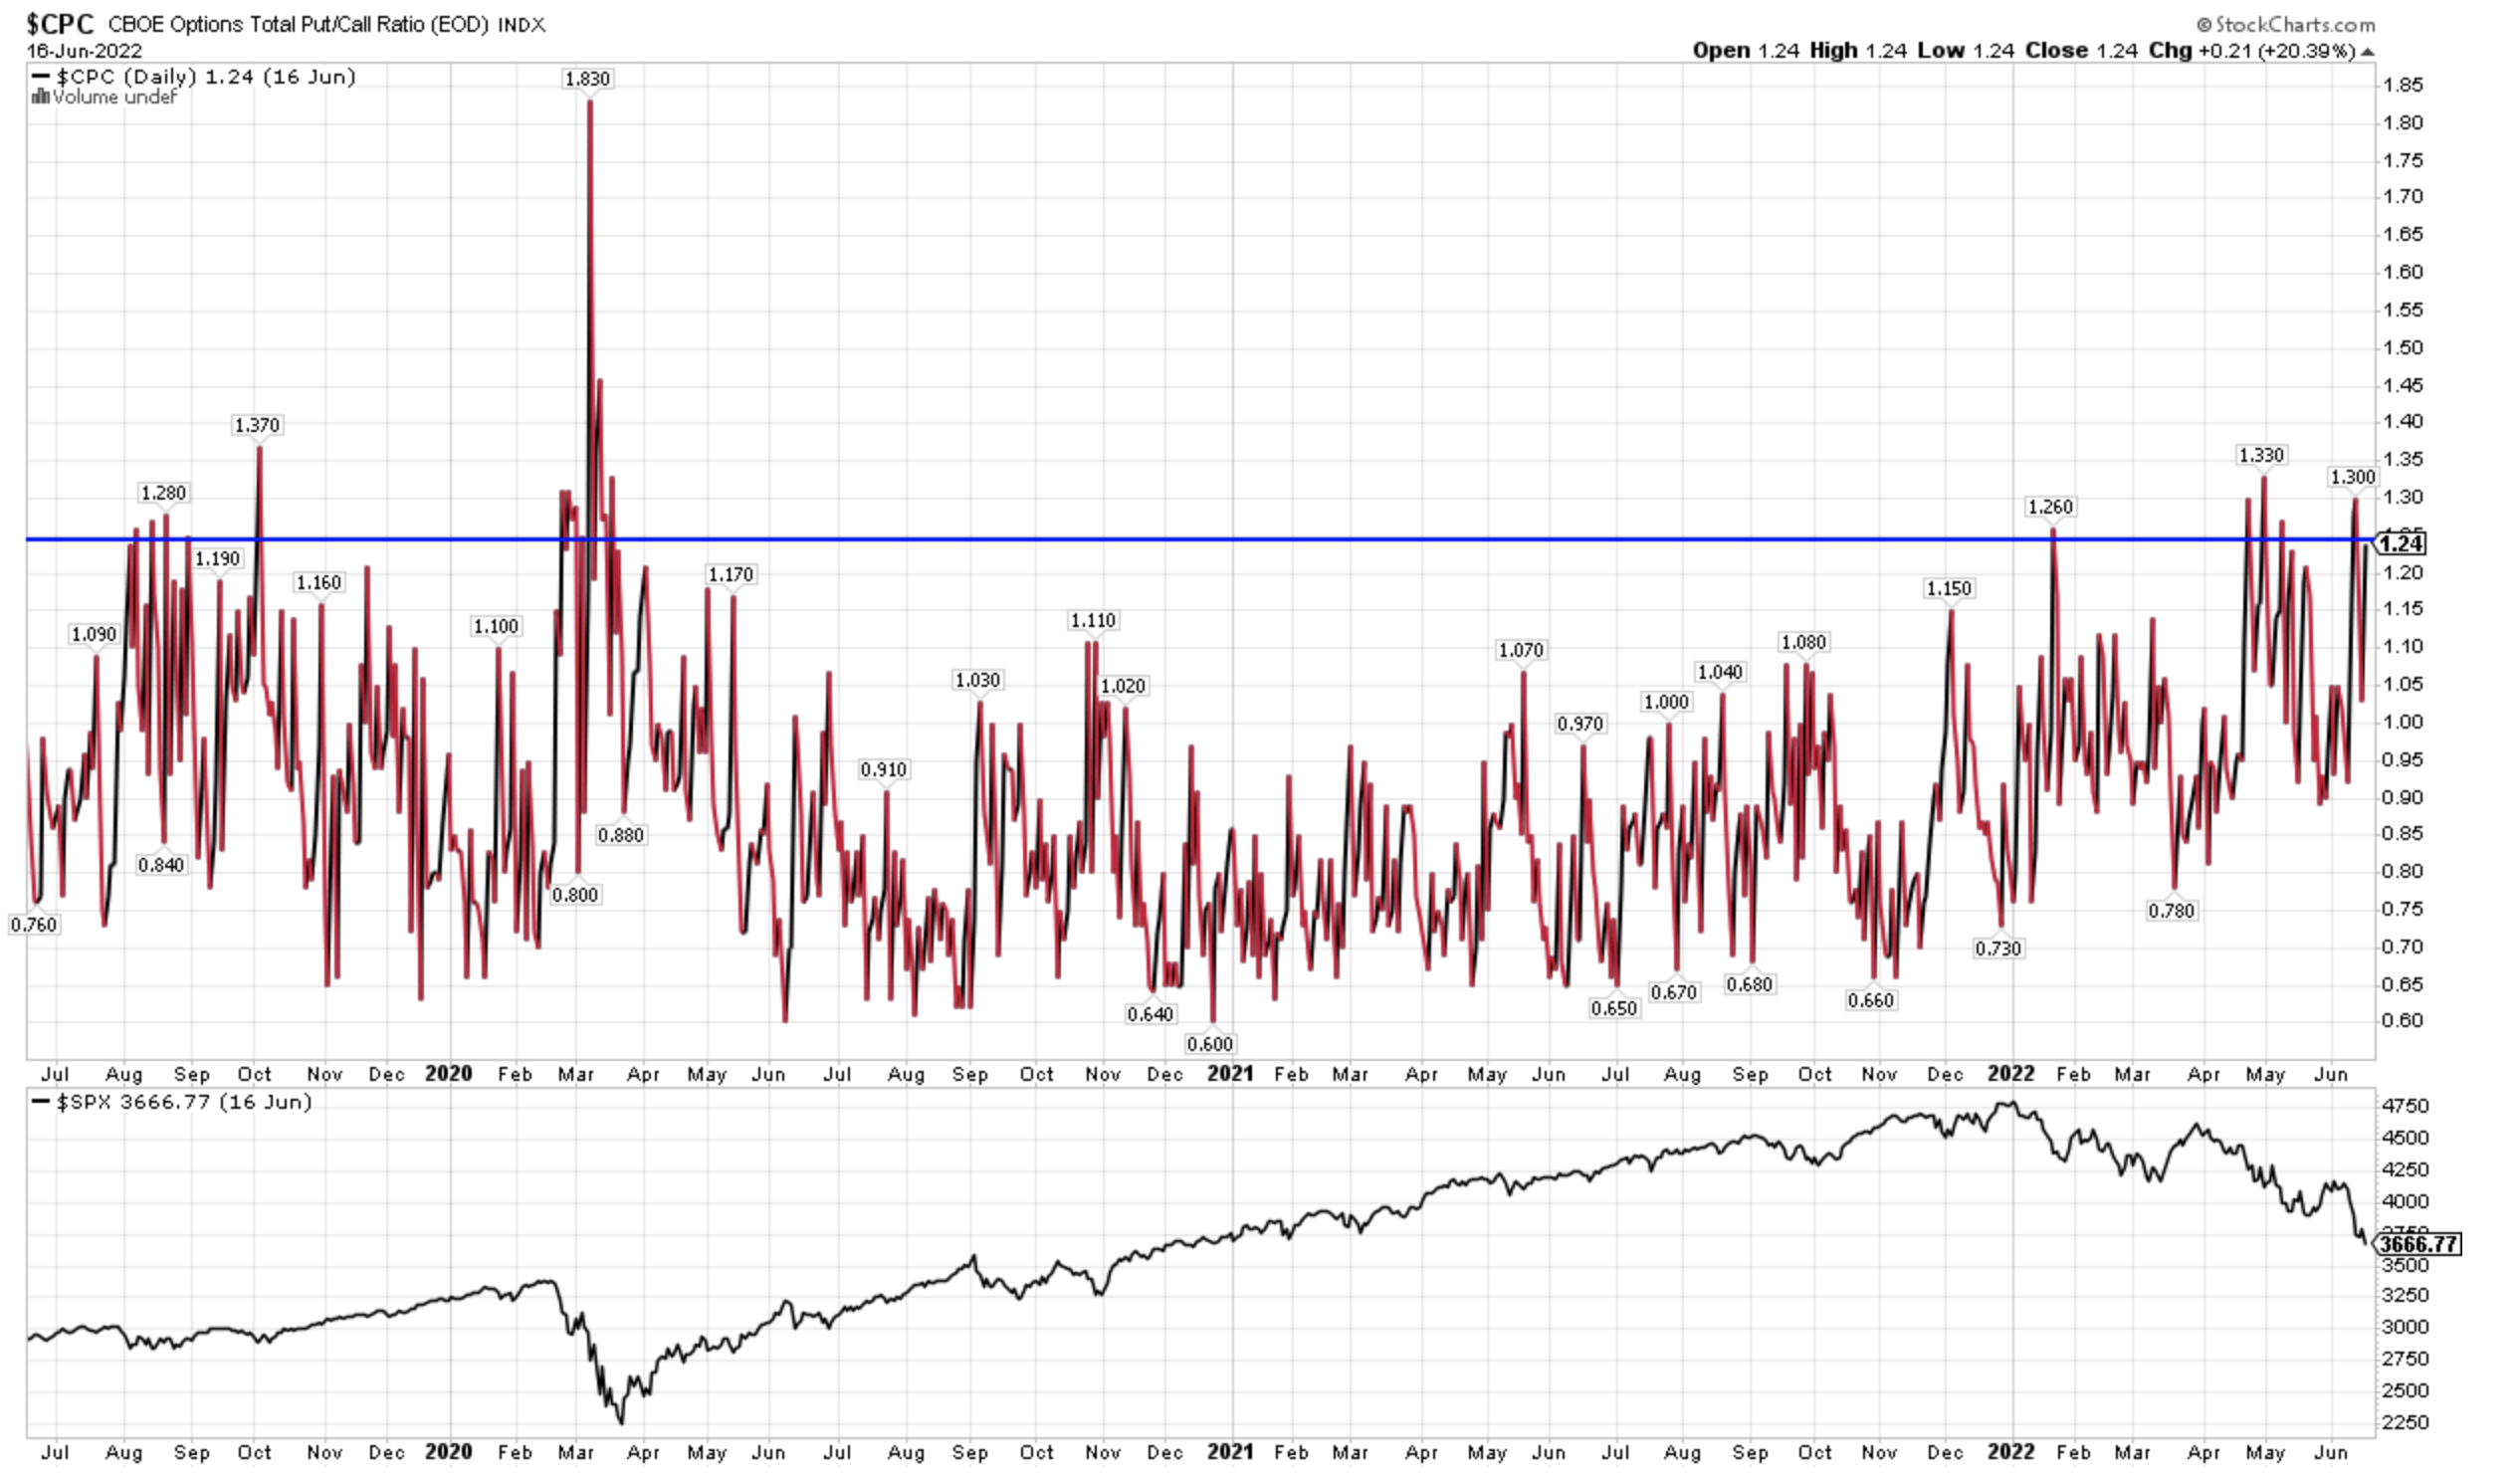
This is a contrary indicator, so anytime you see the “crowd” positioning in an extreme way, it’s often a good idea to do just the opposite.
Now, my last example is something that is more subtle but is nonetheless a tell on what may be shaping up.
The chart below is constructed of a ratio between the NDX and the SPX. Ratio charts are an easy way to gauge the relative performance of one instrument to another.
What one often sees when the market is getting ready to turn is a change in leadership that is signaled via Relative Strength. Notice the positive divergence being displayed.
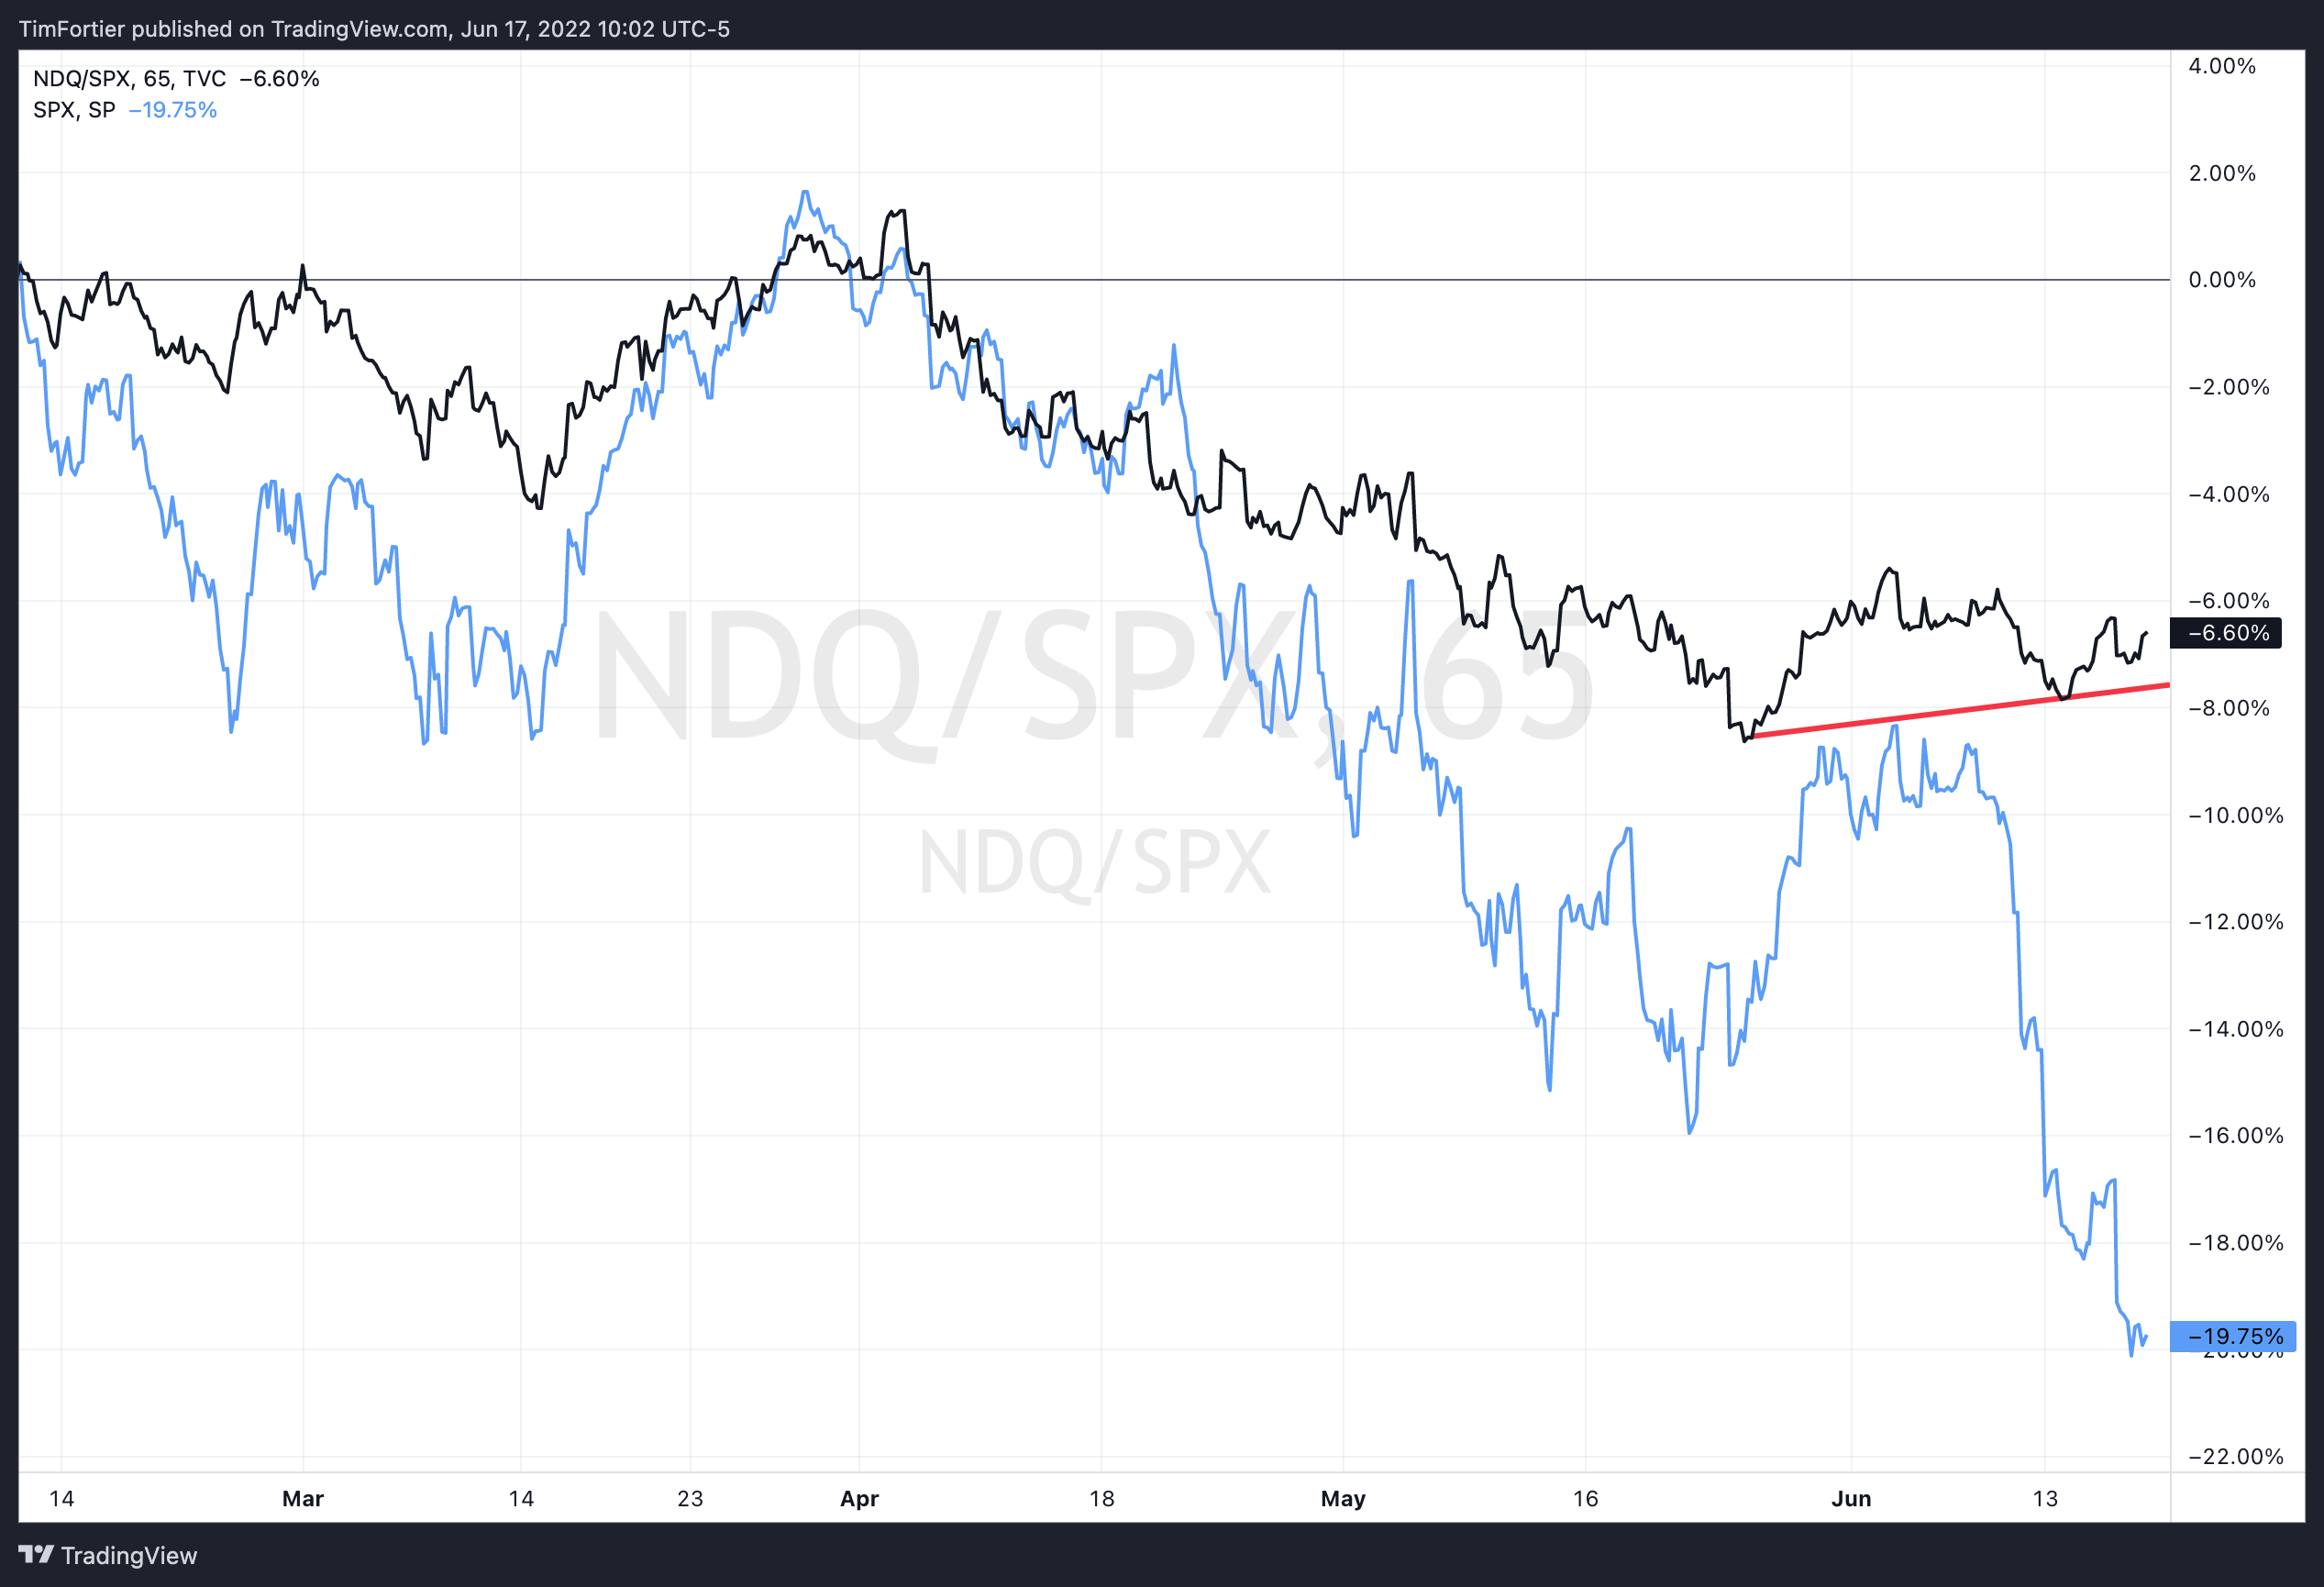
Now, if the market was going to continue on its current trajectory, I would not expect to see this. But given this, I think we might see a relief bounce in the near future that may be led by technology as we see commodity and value take a breather.
Now, don’t think for an instant that I think we are out of the woods. I think there are major macro issues that will remain strong headwinds for some time to come.
The credit markets are one of the best “canaries in the coal mine” in terms of forecasting the stock market and the credit markets are not signaling that all is well.

High-yield bonds peaked a full three months prior to the stock market and gave inventors plenty of warning.
And if credit spreads are widening, it means that investors are beginning to price in a greater chance of default, which likely coincides with what I see as an inevitable recession.
So to be clear on my message, I see an opportunity for another bear market rally within the context of a long-term structural bear market on the horizon.
Caveat: S&P 500 is down more than 12% in 10 days, with 3 gaps, and a deeply oversold condition. If the market can’t put together a rally after that, it’s telling you “I’m very weak.”
So while the conditions are ripe for a reversal, it may come after one final washout, which may carry us into the July time frame.
If you have any questions or have been considering hiring an advisor, then schedule a free consultation with one of our advisors today. There’s no risk or obligation—let's just talk.
Tags

Free Guide: How to Find the Best Advisor for You
Get our absolutely free guide that covers different types of advisory services you'll encounter, differences between RIAs and broker-dealers, questions you’ll want to ask when interviewing advisors, and data any good financial advisor should know about you and your portfolio.
