
Related Blogs
March 16, 2021 | Michael Reilly
 Rotation, rotation, rotation…. It’s the lifeblood of healthy bull markets, so says no other than the godfather of technical analysis, Ralph Acampora.
Markets live in a constant state of flux, always changing, never remaining static. Successful investors are ready and willing to adapt to what-ever markets throw at them.
The question is… are you?
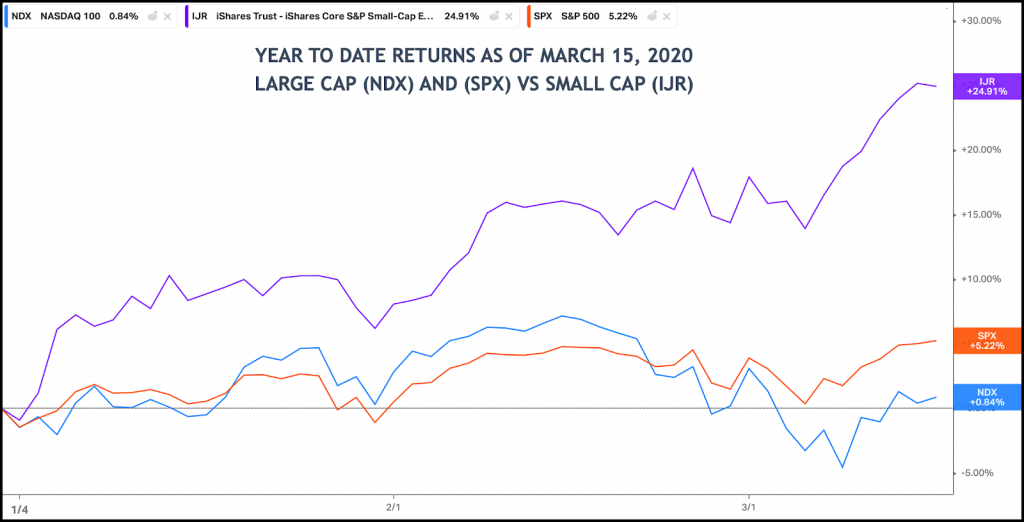
Large-Cap growth stocks have been the place to be. The investment narrative has been simple, Large-Caps over Small, Stocks over Commodities, and U.S. over International.
However, this narrative has been changing since late last year (2020). And investors who have the confidence and ability to drown out the media “noise” and hype, have been able to profit from this new leadership group.
But for those of you who can’t help but get caught up in the daily headlines and emotional rollercoaster that can plague many investors, then maybe you missed it. If that’s you, I’m sorry. Maybe I can help.
Since January 1st, the S&P Small-Cap 600 is up roughly 25%, compared to just a 5% gain for the S&P 500, while the Nasdaq 100 hasn’t broken 1%.
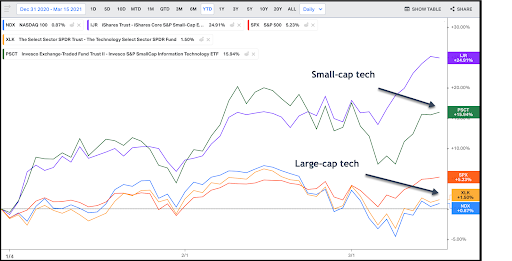
This rotation is evident in what was working, that is no longer, large cap tech was the perennial leader on both a relative and absolute basis for the past several years – until now. Since January 1st, larger cap tech has gotten trounced by the “other” tech stocks- small-cap tech.
While the SPDR Technology ETF (XLK) gained a dismal 1.50% since January 1, 2021, the Invesco Small-cap Tech ETF (PSCT) has rewarded savvy investors with a nearly 16% return – and as an added bonus PSCT has also more than tripled the gains in S&P 500 (5.23%).
The last few weeks has seen its share of ups and downs as the markets withstood three rounds in the ring with volatility. And it’s been the strength of Small-caps scoring a TKO last week and in the process, breaking out to new all-time highs, despite analysts predictions that small-caps are “due for a pullback” or that the trend is “overextended” . What a shocker! (Sense my sarcasm?)
Our investment process calls for finding strong momentum and leadership groups. Follow the money. It’s not only about relative strength – investing in what is strong relative to the alternatives, that’s half the battle. If you want real success, you need to invest in what’s moving too (momentum). More on that in a minute.
The relative strength of small caps versus large caps is obvious in the chart below. It’s a simple relative strength chart – comparing the strength of Small caps to that of Large caps. If the line is moving up, small caps (IJR) are outperforming large-caps (NDX). If the line is falling, small caps are underperforming large caps. Hint, it’s the former.
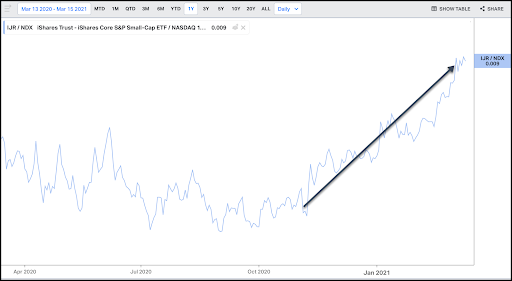
It’s clear small caps are showing tremendous relative strength when compared to their large cap cousins.. But we also want to dig in and take a look at small-cap momentum – we’ll do that using a different RSI. The Relative Strength Index.
The relative strength index (RSI) is a momentum indicator used in technical analysis that measures the magnitude of recent price changes to evaluate overbought or oversold conditions in the price of a stock or other asset.
The RSI is an oscillator that moves between two extremes and can have a reading from 0 to 100.
Traditional interpretations of the RSI are that values of 70 or above indicate that a security is becoming overbought or overvalued and may be primed for a trend reversal or pullback in price. An RSI reading of 30 or below indicates an oversold or undervalued condition.
Because we focus on leaders, we expect to see an RSI at or near overbought readings (70 and above). And if you’re someone who thinks a stock being overbought is a bad thing – answer this question, since when is an overwhelming amount of buying a bad thing?
Contrary to what many investors have been led to believe, a high RSI momentum does not mean you missed the boat – you see, overbought rarely means over.
Momentum, like the kind IJR is exhibiting, is a characteristic of a strong uptrend… and it’s something the S&P 600 (IJR) has been doing since November of last year.
Invesco Small-Cap 600: the top panel is the price chart and the lower panel is the RSI. I’ve highlighted both the oversold and overbought regions of the momentum indicator (30/70)
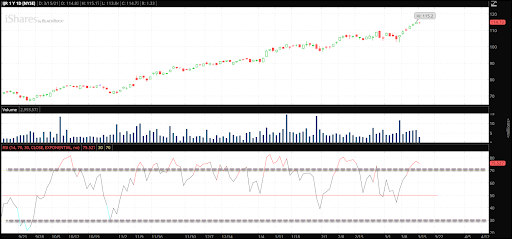
Not only is IJR showing strong momentum as the overall market moves higher, but IJR is holding up well on pullbacks.
See the RSI above, momentum hasn’t fallen below 50 in more than 4 months and speaks to the strong demand underlying this rally in Small-Caps.
And the RSI has remained in a bullish regime – never breaking below 30 since September of 2020. This is another positive and is further evidence that buyers are most definitely in control.
Again, strong momentum and consistently overbought readings are not bearish… It’s quite the opposite.
The bottom line is that while these extreme momentum readings should warrant caution in the short-term, when we look out over any significant time horizon, these signals often occur at excellent times to be buying stocks.
So, the question – should we be buying or selling stocks? The answer – it depends!
Are you looking out over the next few days and weeks… or the next few months and quarters.
For those traders looking for a quick hit- it’s more of a coin toss. However, for investors who are looking to make money this quarter, and aren’t as concerned with the day-to-day noise and volatility of markets, this may yet be another piece of evidence suggesting being a buyer – especially of the small caps.
Will this time be different? To find out, check back with us in the weeks to come.
If you find this article interesting or would like to learn more about how Rowe Wealth Management manages money click here to schedule a free consultation.
Until next week, invest wisely….
Tags

Get Our FREE Guide
How to Find the Best Advisor for You
Learn how to choose an advisor that has your best interests in mind. You'll also be subscribed to ADAPT, Avalon’s free newsletter with updates on our strongest performing investment models and market insights from a responsible money management perspective.
