
Related Blogs
October 10, 2018 | Michael Reilly
Record highs in the DJIA, The S&P500, and Nasdaq are misleading investors into a false sense of security.
That’s because while the DJIA, the S&P 500, and the NASDAQ are all rising to record levels, the “true market” is flashing red.
For proof, look no further than the NYSE Bullish Percent Index or NYSE BPI. It’s considered the granddaddy of risk barometers.
And as of last Friday’s close, it’s sending caution signals to any investor savvy enough to listen.
You see, the NYSE BPI is a breadth indicator, measuring market participation.
A column of “X’s” indicates more and more stocks are rising, meaning increased participation to the upside, a time when stock prices are generally rising – and an opportunity for investors to focus on growth.
But, when more and more stocks that trade on the NYSE move from buys to sells, the indicator moves from “X’s” to “O’s” and is a sign of elevated risk to investor capital.
And that’s what’s happening right now…
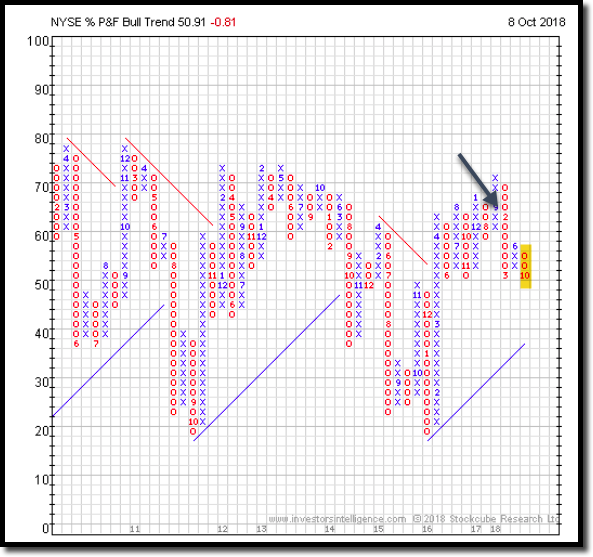
I’ve highlighted the change from demand for stocks (X’s) to selling of stocks (O’s) in the month of October (far right of chart).
For those unfamiliar with this type of chart, it’s saying that we’re seeing reduced market participation and an increase in supply (selling) over demand (buying) for stocks, resulting in lower and lower prices.
If I were a chef looking for ingredients for a tasty meal (rising stock prices) I wouldn’t want to add any of those to my main course! Talk about heartburn..
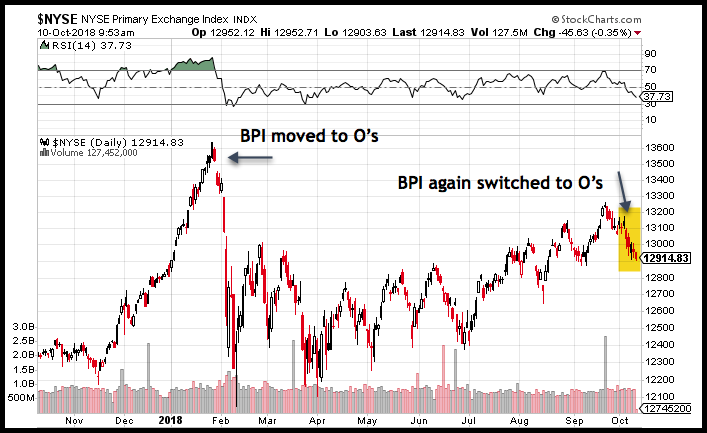
The last time we saw the NYSE BPI reverse down into a column of “O’s” was in February – marked by an arrow on BPI chart above.
When that happened, a market correction soon followed that wiped out all of January’s market gains, leaving markets in negative territory.
We don’t know if October will be a repeat of what we experienced earlier this year. Only time will tell.
For now, it’s best to heed the NYSE BPI’s warning signals and take more defensive measures with your money.
Now, let’s be clear – when I say take defensive measures, I don’t mean sell everything, go to cash, and head for the hills.
After all, the NYSE BPI and other indicators are just that – indicators.
The job of any indicator is to help you as an investor evaluate the probability of a particular outcome.
It’s not foolproof and often comes with certain caveats. This is true of the NYSE BPI as well. More on that shortly…
So, a more prudent risk management strategy in this market might include reviewing winners and losers, selling weak stocks, raising cash, tightening stops, or considering protective puts.
Now, back to the caveat..
Although the NYSE BPI is now in O’s and risk has increased, it’s not a hard-fast rule that you hit the panic button and sell.
An important consideration is the strength of the U.S. Equities asset class when this reversal takes place.
A reversal from X’s to O’s at a time when Domestic Equities are considered strong – meaning the #1 or #2 ranked asset class (out of the six major asset classes) has historically resulted in stable markets.
For example, a recent study published by Nasdaq Dorsey Wright concluded that between April 17, 2000 and October 5, 2018, the average return of the S&P 500 during “strong market” periods was 2.31%.
But during times when U.S. equities were considered “weak” – meaning ranked #3 or lower, (between March 14, 2001 and July 11, 2016) the results were much different, with average returns of -1.13% for the S&P 500.
So, here are some key takeaways from todays NYSE BPI readings:
- There is elevated risk in the market – investors should consider a more defensive posture with their investment capital until the BPI moves back to X’s indicating demand for stocks has returned.
- Although we are seeing additional selling creep into the markets, U.S. equities still remain the single strongest asset class in which to invest.
- Historically when U.S. equities are considered “strong”, domestic markets have shown positive long term returns.
Unfortunately, some investors will panic and sell or bury their heads in the sand. And no amount of rational conversation will help.
But the ones who can keep calm because they understand the technical picture (like those who use relative strength analysis techniques like we just discussed) will use this time tested strategy to periodically adjust their portfolio from offense to defense and back again, based on market conditions, finding opportunity where others see panic.
This may be a good time to discuss these current conditions with your financial advisor. If you’re a client of Rowe Wealth, you probably already know that this is something we’ve had our eye on (that’s why we’re writing about it!)
If, on the other hand, your current advisor isn’t concerned about the warning signs and hasn’t reached out to you about taking defensive measures, you might want to consider making an appointment with a member of our team.
We’d be more than happy to review your portfolio and inform you of whether or not you’re holding positions that might cause you some problems in the future. Qualified investors (with accounts totaling $500,000 or more) are entitled to a completely free portfolio analysis, even if you’re not interested in becoming a client of Rowe Wealth.
Click here now to see available call times.
And, as always, invest wisely.

Get Our FREE Guide
How to Find the Best Advisor for You
Learn how to choose an advisor that has your best interests in mind. You'll also be subscribed to ADAPT, Avalon’s free newsletter with updates on our strongest performing investment models and market insights from a responsible money management perspective.
