
Related Blogs
November 1, 2019 | Michael Reilly
Today marks the beginning of what is referred to as the “strong season” for stocks – the six months between November and April. That also means markets have survived the seasonally weak six months of the year – the months between April and October. 
So should we be looking for stocks to sell or should we be looking for stocks to buy?
Guess that depends on who you listen to.
Contrary to what some so-called “financial experts” continue to expound over the financial airways, the reality is, we continue to see breadth expanding. That means lots of buying, not selling.
For me, the best way to see this is in the price charts – because at the end of the day, it always comes down to price.
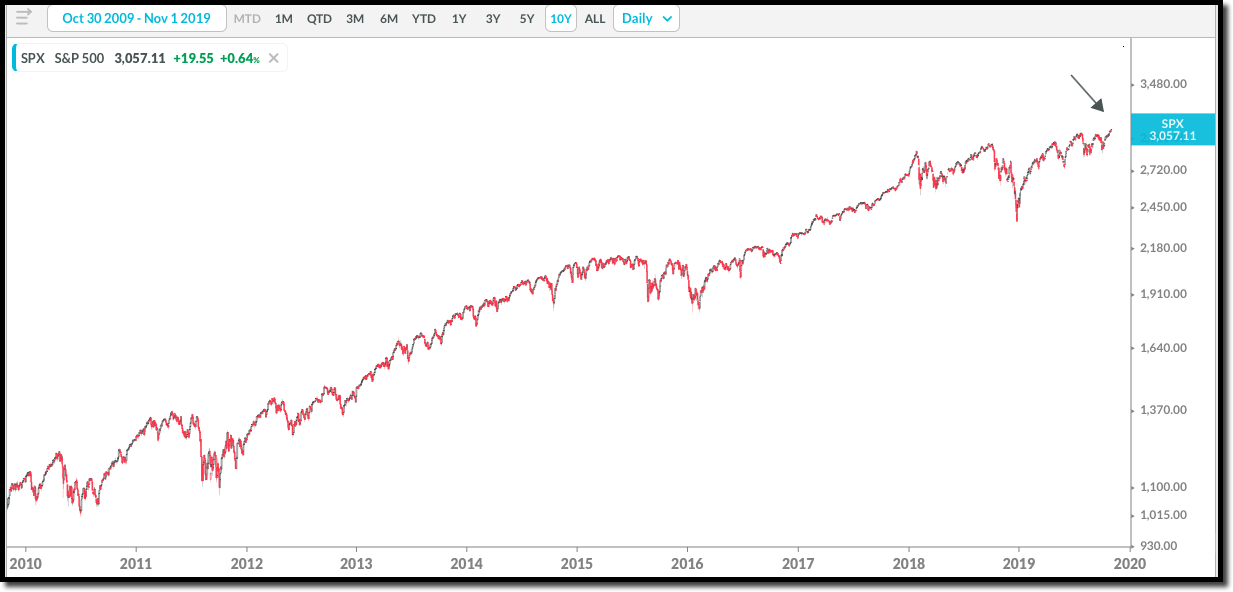
We’ve just seen all-time highs in both the S&P 500 and Nasdaq.
(Click any image to enlarge)

More importantly, it’s not just in the U.S. but globally. We’re seeing more and more countries around the world breaking out to new 52-week highs!
In the last week, the Global Dow 100 Index reached new highs. (using the iShares Global 100 ETF as our proxy)
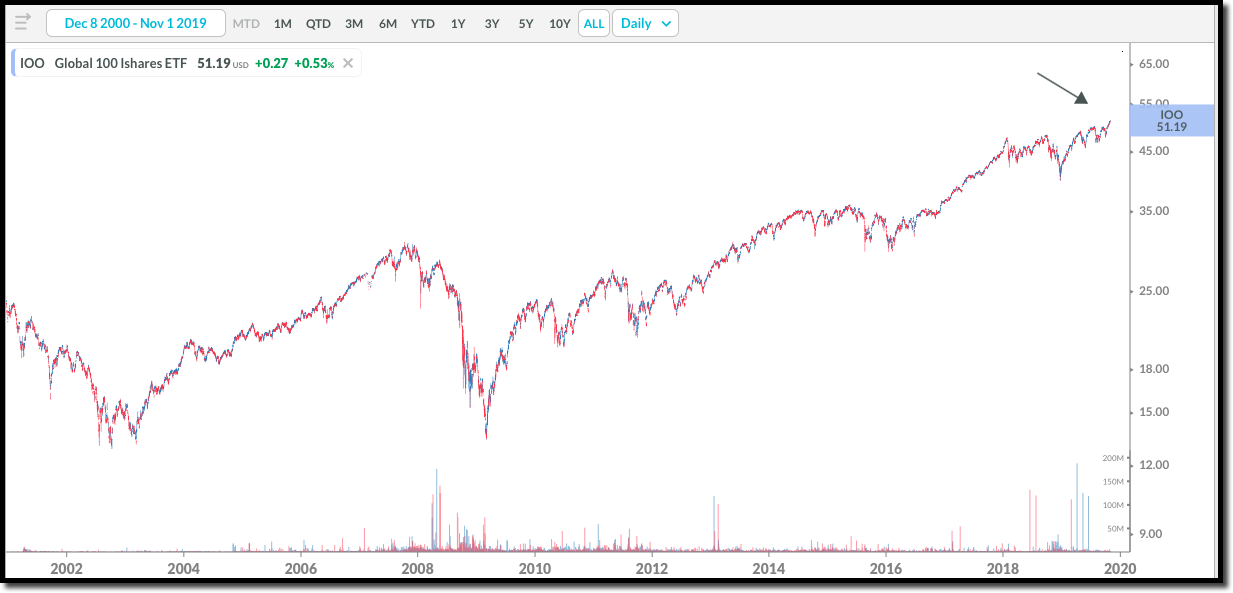
The index, and the ETF that tracks it, own shares in the United States, Japan, Great Britain, Germany, Taiwan, Brazil, Switzerland, China, Hong Kong, France, India and Spain.
We’re seeing new highs in these markets. These new highs indicate breadth expansion, not the deterioration that the bears are preaching.
You can’t hit new 52 week or all-time highs without real demand.
It’s become a global story again, with both international and domestic markets posting new highs.
And this has led to an reversal in one of our important global equity indicators.
If we’re interested in what’s happening globally, it’s our go-to technical indicator.
It’s an indicator you’ll likely never hear talked about on any financial network – too bad.
It’s the Bullish Percent for All Equity Funds. And after sitting in a column of Os since August of this year, it flashed a positive signal by reversing back up into a column of Xs at 76%.
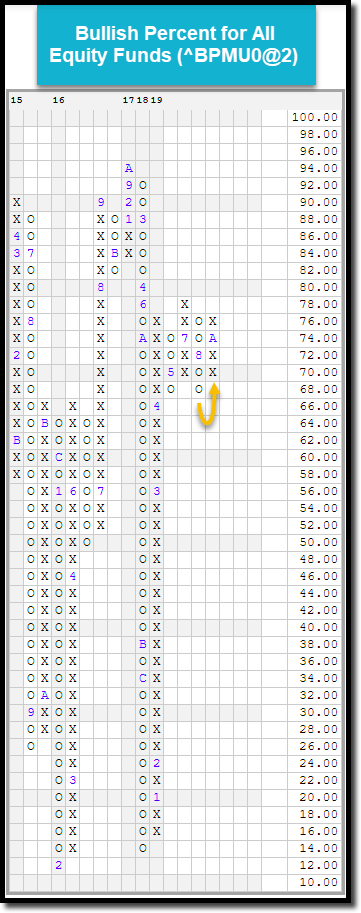 Chart courtesy of Nasdaq Dorsey Wright
As a refresher, this indicator measures the percentage of all equity-related ETFs and mutual funds in both the U.S. and international spaces that are on a current point & figure buy signal on their intermediate-scale charts.
What the chart is saying to investors is that more and more stocks, both domestically and abroad, are showing demand taking control on an intermediate term basis.
The improvement we’re seeing on the intermediate-term chart follows the reversal we saw in the shorter-term Bullish Percent for All Equity Funds earlier this month, demonstrating further follow-through for the general global equity space.
Maybe I’m wrong, but that doesn’t sound bearish.
Yet, if you ask around, you’ll likely hear that it is.
It’s a funny thing – when markets are strong and hitting new all time highs, investors often get worried that it’s time to sell.
At least, that seems to be the sort of mentality that we’re seeing now.
Warren Buffett – the Oracle of Omaha, coined the phrase “be fearful when others are greedy and greedy when others are fearful”.
Sentimentrader shared a Barron’s survey early this week that helps put things in perspective.
At the bottom of the market in 2002, 43% of “big money” investors in a Barron’s survey were bullish” – At the bottom in 2008, 59% were bullish. At the bottom in 2016, only 38% were bullish”.
In each of those instances, the market when on to reach new all time highs. So, it often pays to get in when other investors want to get out.
According to the Barron’s survey, “Only 27% of big money investors are bullish now.”
Does that sound like euphoria? To the contrary!
Remember, sentiment indicators are a contrarian indicator..
Another one of W. Buffett’s quotes -“Face up to two unpleasant facts: the future is never clear and you pay a very high price in the stock market for a cheery consensus”.
Lucky for us, consensus today is not so cheery!
I’m not sure what people are so scared these days. Breadth is expanding – you can see it in the technicals. More stocks and sectors are participating. We’re seeing more and more countries around the world making new highs.
So, if that’s the case, shouldn’t now be the time to look for opportunity?
If you’re interested in a helping hand with positioning yourself for maximum profit potential, consider calling us at 866.711.2836 Ext 3 to schedule an appointment with a Rowe Wealth advisor.
Investors with accounts valued at least $500,000 are eligible for a completely free portfolio evaluation and stress test. This will help you determine exactly how much you stand to gain or lose over the next six months, as well as identify points of weakness in your portfolio that can quickly be addressed.
Call 866.711.2836 Ext 3 with any questions, or to schedule an appointment.
As always, invest wisely.
Tags

Get Our FREE Guide
How to Find the Best Advisor for You
Learn how to choose an advisor that has your best interests in mind. You'll also be subscribed to ADAPT, Avalon’s free newsletter with updates on our strongest performing investment models and market insights from a responsible money management perspective.
