
Related Blogs
December 29, 2020 | Michael Reilly

Consumer Staples are at their lowest levels relative to the S&P 500 in over a decade.
Consumer Staples stocks are defensive stocks – acting as a safe haven during market volatility for investors or institutions that don’t, or can’t, move to cash or bonds. We call these investors the “long only community”. These are companies like Tupperware Brands, The Boston Beer Company or Keurig Dr. Pepper.
Consumer Discretionary stocks are growth stocks and generally do well in an environment where there is an expectation for economic growth and include autos, retail and home builders.
Underperformance from Consumer Staples is a classic characteristic of a stock market that is in a strong uptrend – like the one we are in now.
So remember that the next time the Doom and Gloomers want to tell you “stocks have come too far too fast”, “stocks are overvalued” or “the sky is falling”. C’mon, you know who you are – stop it!
In previous articles, I’ve shared one of my favorite ratio charts comparing Consumer Discretionary stocks – the growth stocks (XLY) vs. Consumer Staples – the defensive stocks (XLP).
This ratio chart is a very powerful tool and is key to detecting changes in the risk appetite for stocks.
You can read what I had to say here.
But today, we’re going to change it up a bit and compare the relative strength of the S&P 500 to the Consumer Staples sector.
The blue line is the S&P 500 index. The black line is the ratio between the S&P (SPX) and Consumer Staples (XLP).
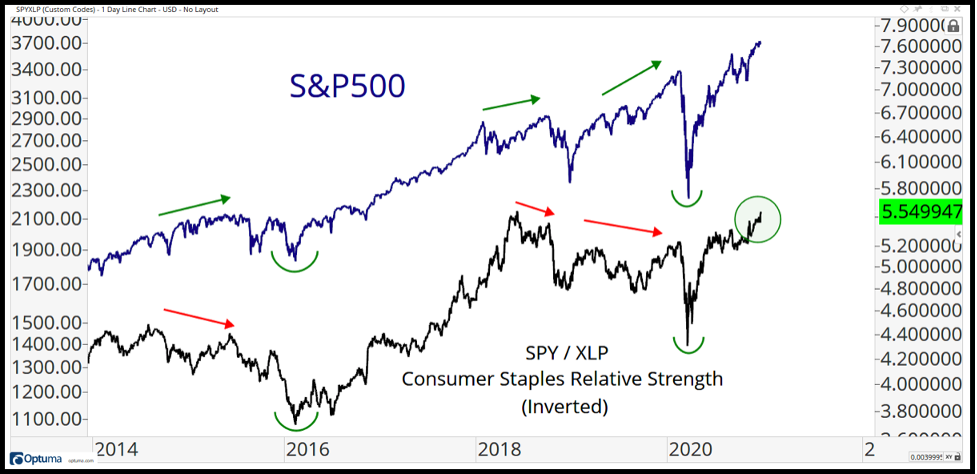
When the black line is moving up, Staples are underperforming the S&P. In other words – the S&P is outperforming Staples.
When the black line is moving down, Staples are outperforming the S&P – as was the case in February and March, as money shifted away from riskier growth stocks and into the relative safety found in the more defensive Consumer Staples sector.
The key take away is that the higher that black line moves up in the ratio chart, the better growth stocks are probably doing. Underperformance from Consumer Staples is consistent with higher stock prices.
The opposite is also true. So, when Staples are outperforming the S&P, it’s likely happening in an environment where stocks are under pressure – the exact opposite of what we are seeing today.
For now, we’re flirting with the lowest relative close in over a decade for Consumer Staples.
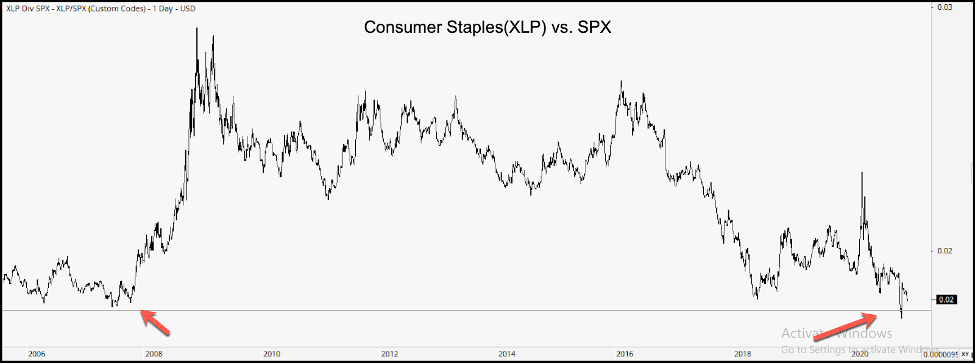
I flipped this ratio upside down – this time I used Consumer Staples (XLP) as the numerator and SPX as the denominator, because here, I’m comparing the strength of Staples to the S&P 500 – whereas the previous chart above compared the strength of the market (SPX) vs. Staples. We’re just viewing the relationship from a different perspective – I thought this was easier than asking you to stand on your head to read the chart – you’re welcome.
The further the black line falls, the weaker Consumer Staples stocks are vs. the S&P 500 index – which is indicative of bull markets.
This is a ratio to watch. A change in trend here and some outperformance from Staples is usually signaling a “head’s up” that something may be wrong.
Until next week, invest wisely.
Tags

Get Our FREE Guide
How to Find the Best Advisor for You
Learn how to choose an advisor that has your best interests in mind. You'll also be subscribed to ADAPT, Avalon’s free newsletter with updates on our strongest performing investment models and market insights from a responsible money management perspective.
