
Related Blogs
September 21, 2021 | Michael Reilly
 The S&P 500 has printed 53 new all-time highs through the end of August – a record for this point in any previous year.
And year-to-date, the index was up more than 20% going into Monday’s trading session.
But investors beware…
Because stocks have once again entered the seasonally weak period between September and October, which historically brings added volatility and investor angst.
So now they’re doing exactly what we’d expect them to – selling off.
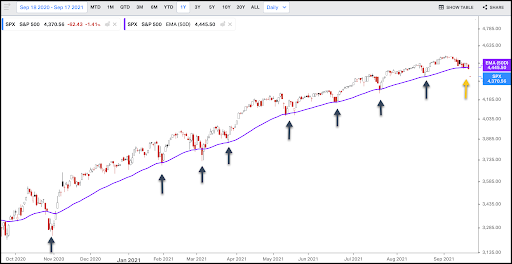
In fact, the S&P 500 is testing its 50-day moving average again.
In 2021, every month but April has seen the S&P 500 test its 50-day average – and each retest of the 50-day has ultimately resolved higher…
Whether that happens this time remains to be seen.
Investors would be wise not to brush off this latest retest and assume the index will once again resolve to the upside…
Because based on the most recent investor sentiment data, investors are re-evaluating their bullish views on stocks…
That’s right – both individual investors and professional advisors are becoming more pessimistic than any time in the past year.
An unwind may be in the works and they tend to happen fast and furious.
The percent of stocks in the S&P trading above their shorter-term 50-day averages has dropped to 44%.
That means that more than half of S&P stocks have now fallen below their 50-day moving average. Not exactly a signal of strength for stocks.

At the start of September, 70% of stocks trading in the S&P were trading above their 50-day moving average – that number has fallen by 30% in a matter of weeks. Ouch.
That suggests there has been a lot of selling going on beneath the surface out of sight of the average index watcher.
Remember, the S&P 500 is a weighted index led by a handful of mega-cap companies like Google, Facebook, and Tesla. So a rise in the index which is led by these companies can be very misleading.
Investors should not ignore this selling going on under the surface, because it will affect your own pockets.
The weakness hasn’t been contained to the short-term 50-day moving average. It’s creeping into the longer-term charts as well.
The red line below indicates the percentage of stocks trading above their 200-day moving average falling to 72%.
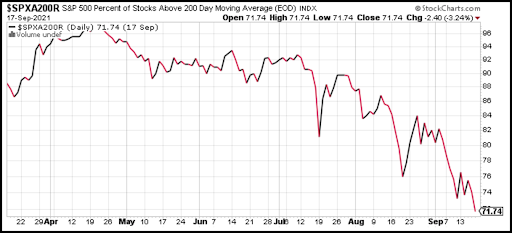
That’s a 20% drop vs. the percentage of stocks trading above their long-term 200-day moving average in July. This is a big signal that short-term marker weakness is turning into something larger.
Also, be sure to watch these 50-day and 200-day moving averages because a ton of computerized trading takes place at these averages.
So, what we see happening the last week or so, is the index finally slowing down to what most stocks have been doing.
Most stocks have not been going up for a while now.
Some stocks have been doing well, but most have not.
Investors need to look beyond the indexes and look at the real data to see what is happening here.
Remember, this is a market of stocks. So follow the price action of stocks, not an index…
Keep checking back here as we continue to share the price and breadth indicators we believe best represent the most important market data for investors to watch.
Stay tuned as we dive deeper under the surface… until then, invest wisely.

PS: We understand investing can be stressful and difficult, so if you want to talk about how we make it easier, give us a call. We’re opening our doors to new investors who have portfolios valued over $500,000. If you’d like to schedule a free 1-hour consultation to review your portfolio, click here.
Tags

Get Our FREE Guide
How to Find the Best Advisor for You
Learn how to choose an advisor that has your best interests in mind. You'll also be subscribed to ADAPT, Avalon’s free newsletter with updates on our strongest performing investment models and market insights from a responsible money management perspective.
