
Related Blogs
November 21, 2022 | Avalon Team
The behavior of the stock market is controlled by large fund managers.
There are organized “buy programs” and “sell programs.”
When a buy program is in play, “demand is in control.” There’s a concerted effort to accumulate stock positions in a controlled way that gradually pushes prices higher.
When there’s a buy program in play, traders are well served to be buyers and owners of stocks. The opposite is true when supply is in control (sell programs).
The Bullish Percent Index is a stock market indicator that offers a consolidated measure of the percentage of stocks trading on buy signals on their respective individual P&F charts. Therefore, it does a great job of telling us whether the stock market is in “demand mode” or “supply mode.” It’s also a great measure of overbought or oversold market conditions.
In short, it tells us how much risk there is for traders to own stocks at the time. Traders who are willing to be more aggressive will buy at lower prices even though there’s inherently a bit more risk.
Others want to see more confirmation and are willing to accept higher entry prices in exchange for the comfort of taking less risk (not to be confused with no risk!).
You can take a lot of time and energy looking through 500 individual charts and tracking the number of stocks on buy vs. sell signals, or you can do what I do – pull up the S&P 500s BPI. It’s a single chart reflecting the percentage of all 500 members of the S&P 500 that are on buy signals.
And here’s what it’s saying right now.
For the fourth time this year the Bullish Percent Index for the S&P 500 pushed above 70%, indicating that more than 70% of all the stocks trading on the S&P 500 are on buy signals on their individual charts.
There are multiple implications here. The first is more obvious.
When stocks are on buy signals, they’re more likely to move higher, and if over 70% are experiencing this behavior that means a heck of a lot of stocks are poised to go higher.
But to what end? When will they stop? How much downside will there be when they reverse lower again?
We know that the recent direction of the indicator has been up, meaning the current behavior of the S&P 500 is more and more stocks have been showing bullish behavior.
As more and more stocks join the party, it’s said that the S&P 500 is showing positive “breadth” as it’s a broad-based stock market advance. Lots of participation is a good thing when the participation is in bullish behavior.
But there’s always a catch!
The 70% level is considered an “overbought” market. I put quotes around the word “overbought” for a good reason. This word confuses people who aren’t technical analysts.
Being overbought is not necessarily a bad thing – it signals a lot of buying and that’s bullish. And we’d like to see that strength continue. As the old adage states, “Overbought doesn’t mean over.”
The problems arise when the BPI moves from above 70% back below it. And while this is always true, there is a caveat: It’s less of a problem for bullish investors when it happens soon after the BPI has been below 30% or “oversold.”
You see, for the BPI reading to have gotten to that very low level there has to have been an enormous amount of selling pressure. To move stock to a sell signal requires lots of selling.
Think of it as bearish ammunition. The shares of stock for sale are like the “ammunition” to the bears. When the fund managers initiate “sell programs,” they are basically selling so much stock that they are steamrolling over any walls of buyers at prices at which buyers have historically stepped in to buy loads of stock.
You don’t want to mess with those sell programs. It’s like one soldier with a machine gun standing in front of an approaching tank and hoping to hit that lucky shot.
But for the BPI to get below 30, no matter how powerful those bears had been, they have to put up a huge fight. They have to have spent a lot of their ammunition (sold a lot of shares). At the end of that battle, you know that a lot of the sellers have sold. Basically, anyone who would have sold out of fear has been “shaken out” of the market.
After exhausting the sellers, it’s very easy for buyers to move prices higher. After all, the only reason it’s difficult for stocks to move higher is the pesky sellers getting in the way, creating a wall of selling pressure.
But seller ammo has already been largely depleted. And that’s why you’ve seen stocks jolt so much higher so quickly lately. The sellers are nowhere to be found. When you have buyers with no sellers, stocks advance easily.
What happens when that BPI reverses lower again? It depends on when it happens.
So let’s talk about caveats…
First I’ll say that no matter when it happens, it’s a tell that the buyers might be somewhat exhausted.
Depending on when it happens, on one level or another, buying is waning. The buyers might be running out of ammunition. The sellers are attempting to take control from the buyers. The supply side is trying to take control away from the demand side.
Keep in mind, the buy side and sell side are often trying to take control of one another. Luckily for us, we get to use this special indicator (the BPI) to see when a war is being waged.
Whoever prevails as the winning party is another thing.
- First, we like to know war has been waged…
- Then we watch closely to see who wins.
- Finally, we determine if the win is a short-term battle or the entire war fought between supply and demand.
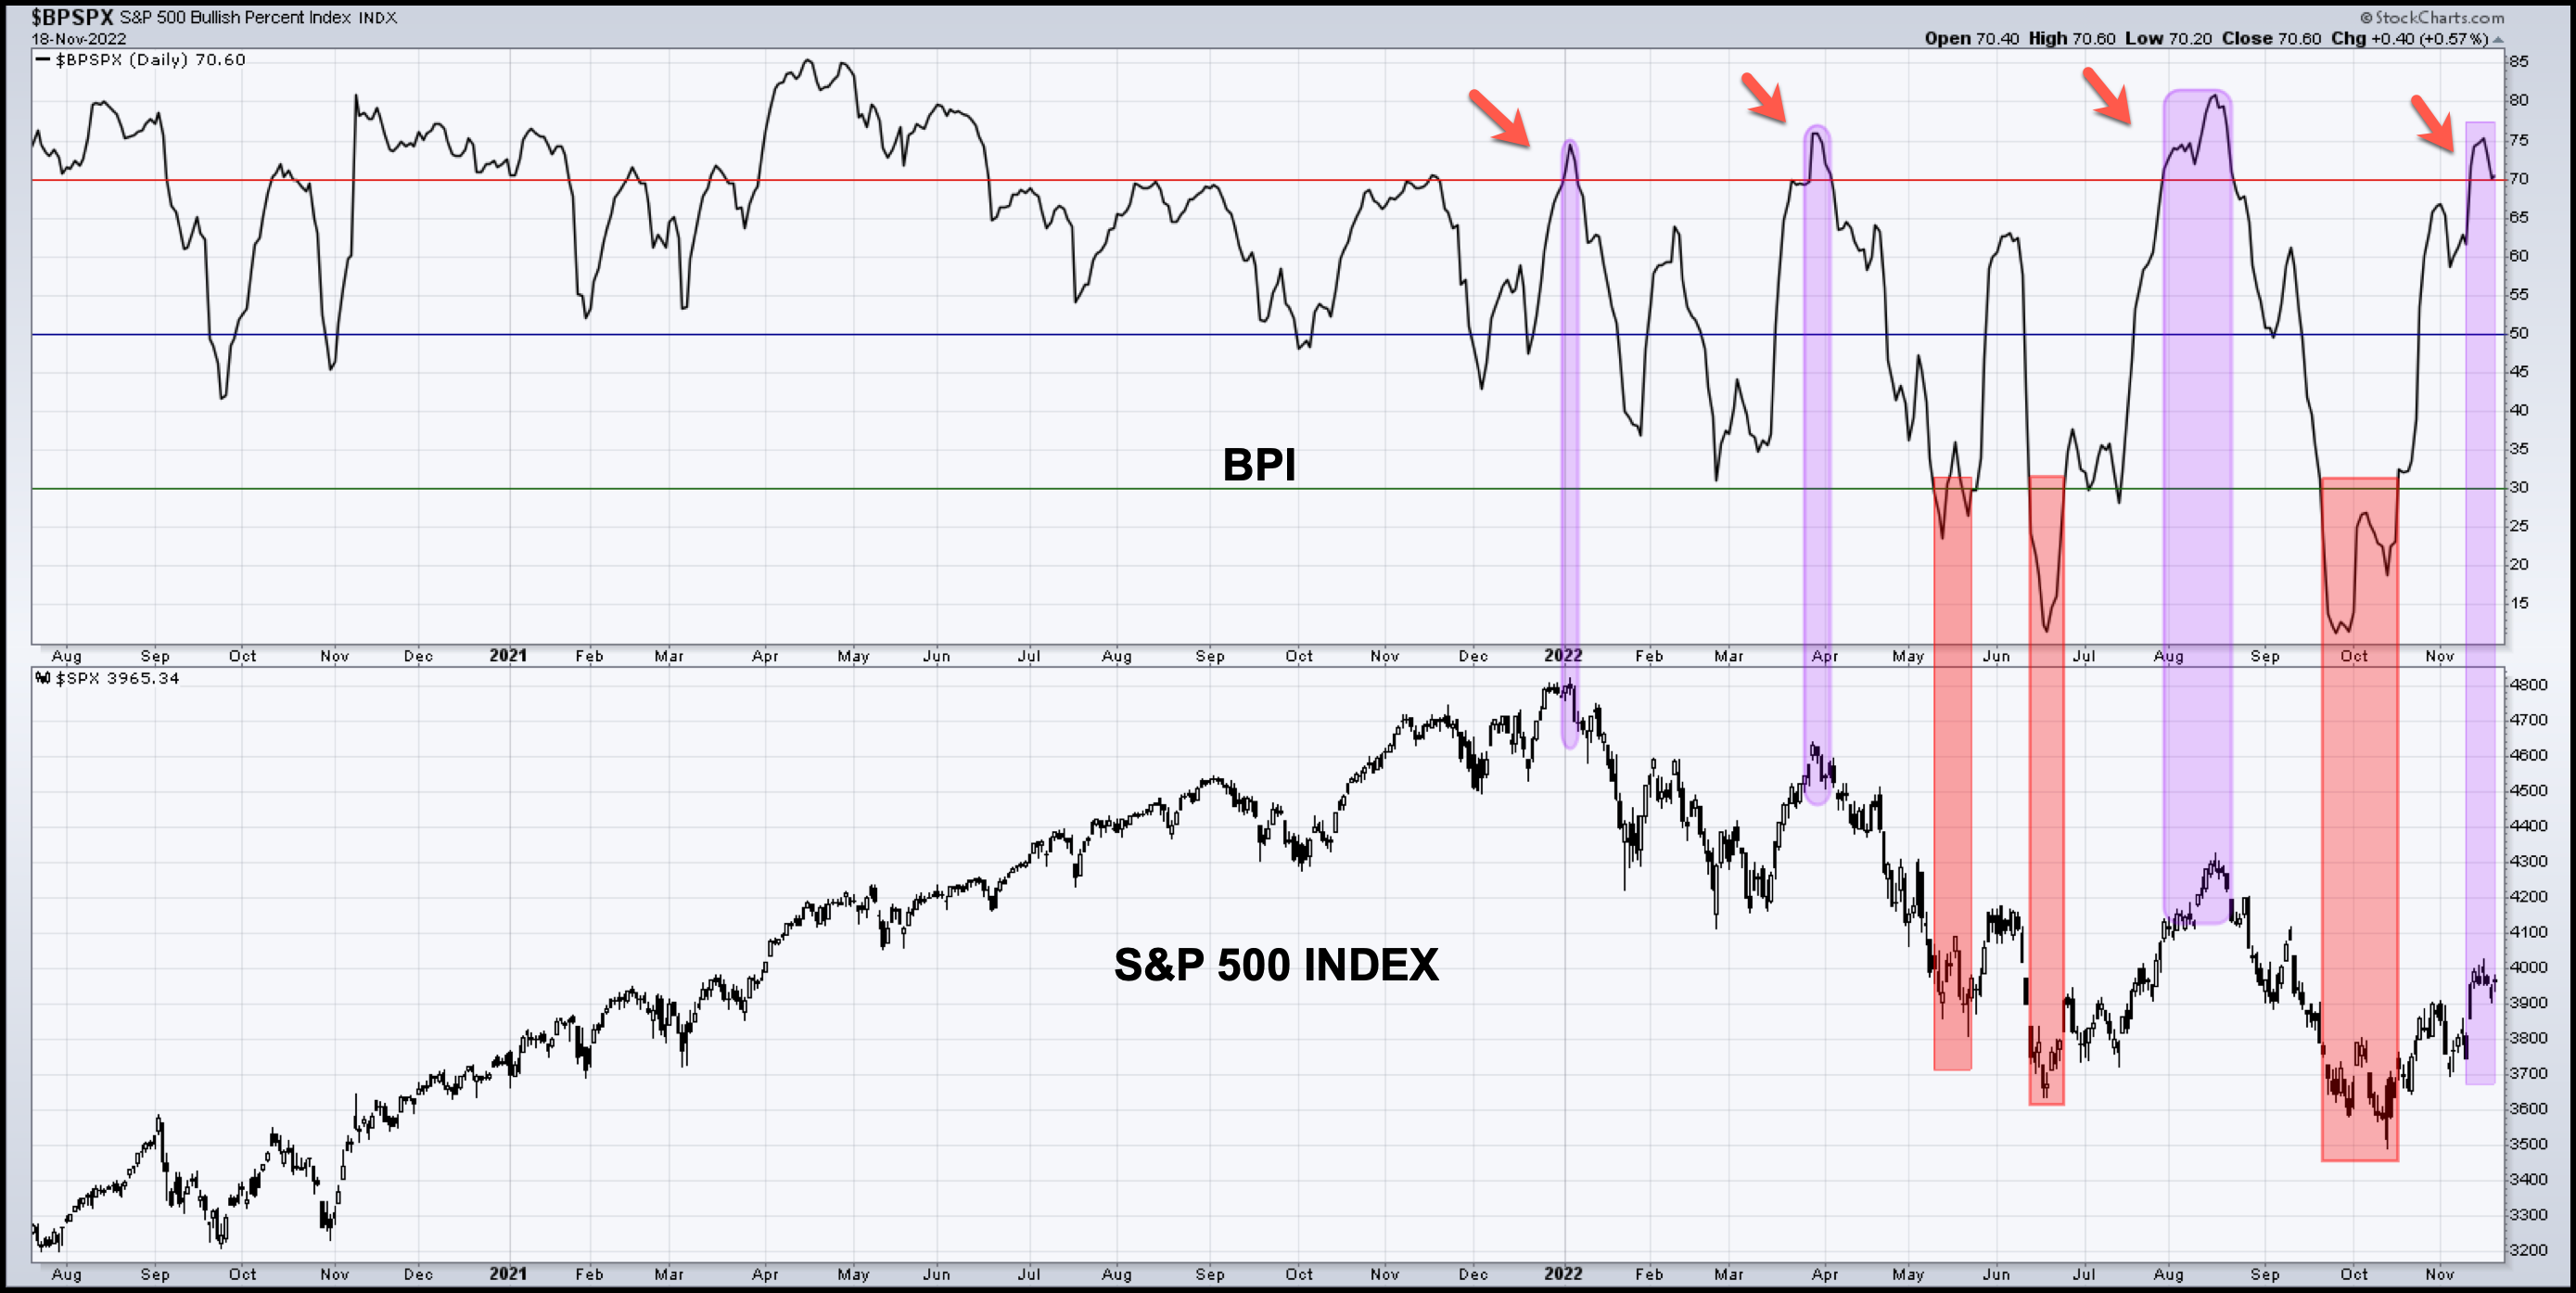
Each time the BPI has moved back below 70 this year, it marked the end of a current stock market rally. I’ve highlighted this in the chart of the S&P 500 BPI below.
But this time is different. I’ll explain that in a second.
Take a look at what the S&P 500 index did after its BPI moved from above 70 to below 70 (red arrows). The S&P sold off after its BPI fell below 70. Notice what the BPI did prior to reaching that “overbought” (above 70) territory.
The first time it had been bouncing around between 50 and 80.
The second time, it had first made its way down to the low 30s.
Both of these times were clear and obvious signals that it was time to exit your bullish positions unless you were willing to hold them through a bear market.
The third time is interesting because the precursor was when the BPI moved below 30 first (red highlighted). After the S&P 500 rallied throughout the summer – a very sharp and, frankly, expected market rally – the BPI moved from above to below 70 and the S&P 500 moved back down to its lows. It even moved slightly lower.
This was expected too. We have been showing charts of what typically happens in a midterm election year since 1950, and this is exactly what we saw and therefore assumed was likely.
So although the stock market gave back all of its summer-rally gains, it didn’t end up continuing the terrifying bear market. Instead, it moved to the lows we pretty much all expected to see in the notoriously weak month of October.
The fourth time on the chart where we see the stock market rally pushing the BPI over 70 leads us to today. This time is different for a few reasons.
It’s in the strongest part of the 4-year presidential election cycle and the strongest part of the year for the stock market. And we have entered the first of the three strongest quarters (9 months) out of the 16-quarter presidential cycle.
We also saw very washed-out oversold levels from the BPIs tied to other major indices like the NASDAQ, the Russell 2000, and the New York Stock Exchange.
We will, of course, be keeping a close eye on this indicator for you and we will keep you posted on its implications. We don’t want to anticipate a reversal lower in the indicator or the stock market.
We will continue to update our models each month to reflect the current market environment because, after all, that’s what our models do.
They ADAPT!
If you have any questions or have been considering hiring an advisor, then schedule a free consultation with one of our advisors today. There’s no risk or obligation—let's just talk.
Tags

Free Guide: How to Find the Best Advisor for You
Get our absolutely free guide that covers different types of advisory services you'll encounter, differences between RIAs and broker-dealers, questions you’ll want to ask when interviewing advisors, and data any good financial advisor should know about you and your portfolio.
