
Related Blogs
October 24, 2023 | Avalon Team
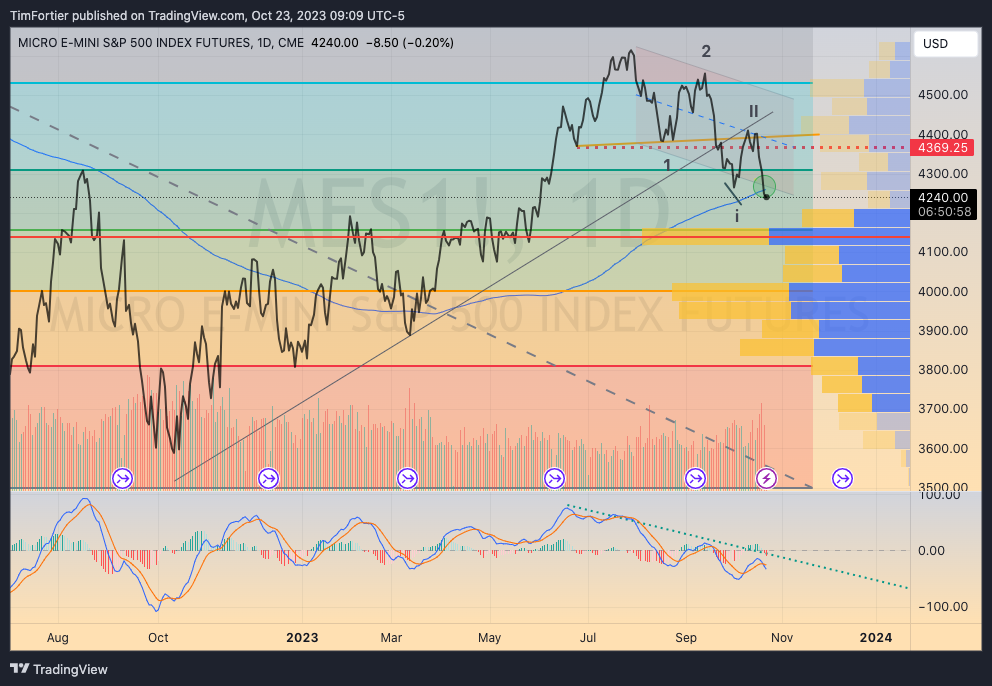
Last Friday the S&P 500 closed below both the 200-day moving average and the previous low – a bearish sign for investors.
While the market-cap weighted S&P 500 remains positive YTD, the equal-equal weight S&P 500 (RSP) has turned negative.
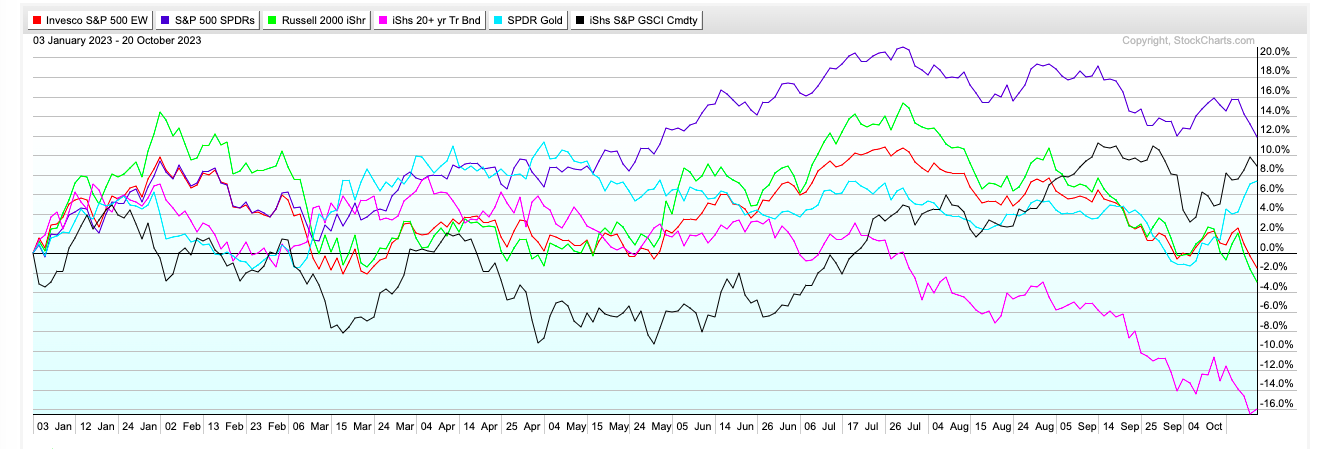
Bonds are having another terrible year, with the iShares 20+ Year Treasury Bond (TLT) now down over -16%.
Both commodities and gold could surpass the performance of the S&P 500 should the trends of the past week continue.
In fact, commodities have recently become the top-ranked asset category based on relative strength, while market internals remain weak.
The NYSE Bullish Percent has failed to provide a buy signal even though some indicators, such as the % 50-day moving average, have reached the “green zone.”
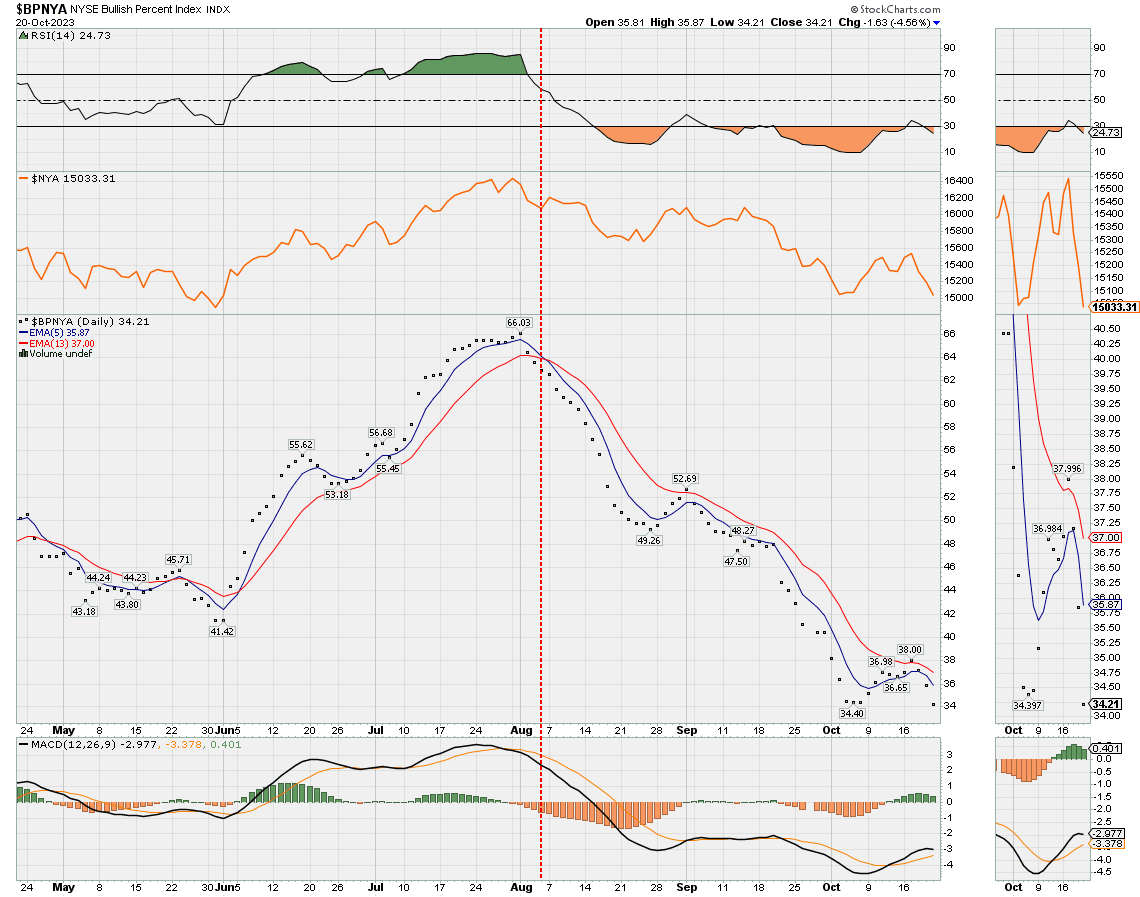
Until the bullish percent indicators show evidence of demand returning to the market, I will continue to view the market defensively.
One has to look no further than the NYSE AD Line to see how market internals continue to deteriorate, with market breadth reaching another low.
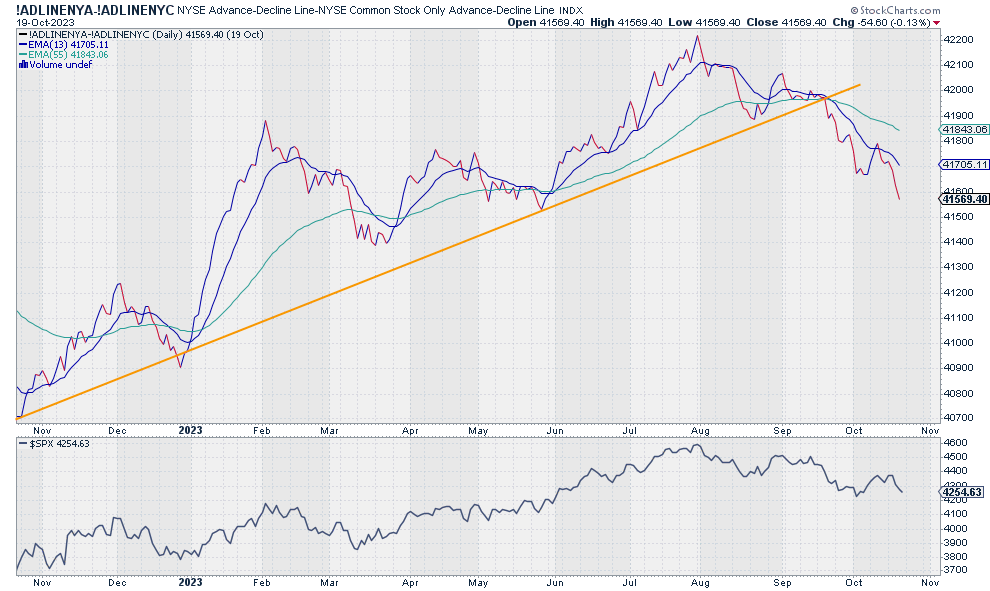
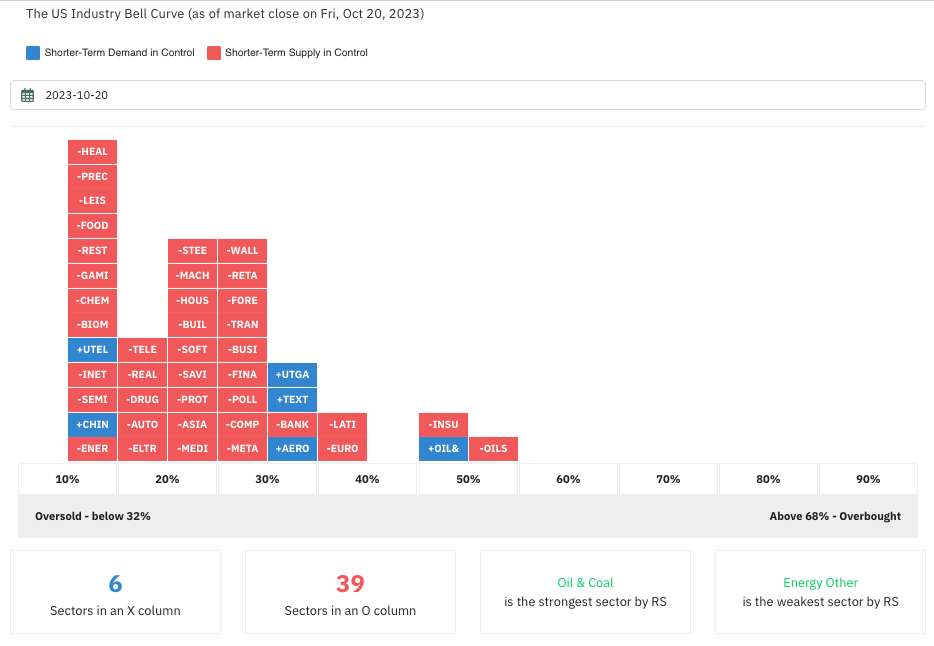
The sector curve remains skewed to the left, indicative of the selling that is going on.
Interest rates and geopolitical risks will remain in focus for the coming week.
The U.S. 10-Year Note touched 5% yesterday and the recent surge has pushed yields to the top of the defined trend channel, so a short-term pullback might be in order.
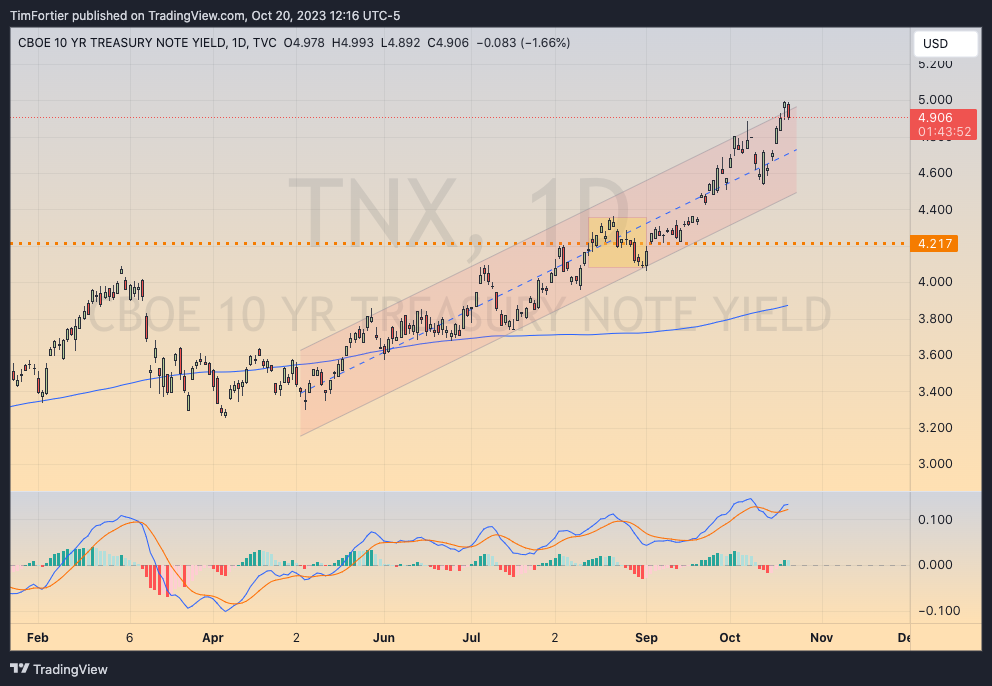
Earlier this summer, I stated that the above chart was “the most important chart in all of finance.”
I still believe this to be true.
As a result of the increase in rates, mortgages hit 8% last week, causing mortgage demand to reach the lowest level since 1995.
This is making already expensive homes even more unaffordable.
The NAHB home index has suffered the third consecutive month of decreases, bringing it to its lowest level since January, as high mortgage rates have heavily impacted builder confidence and consumer demand.
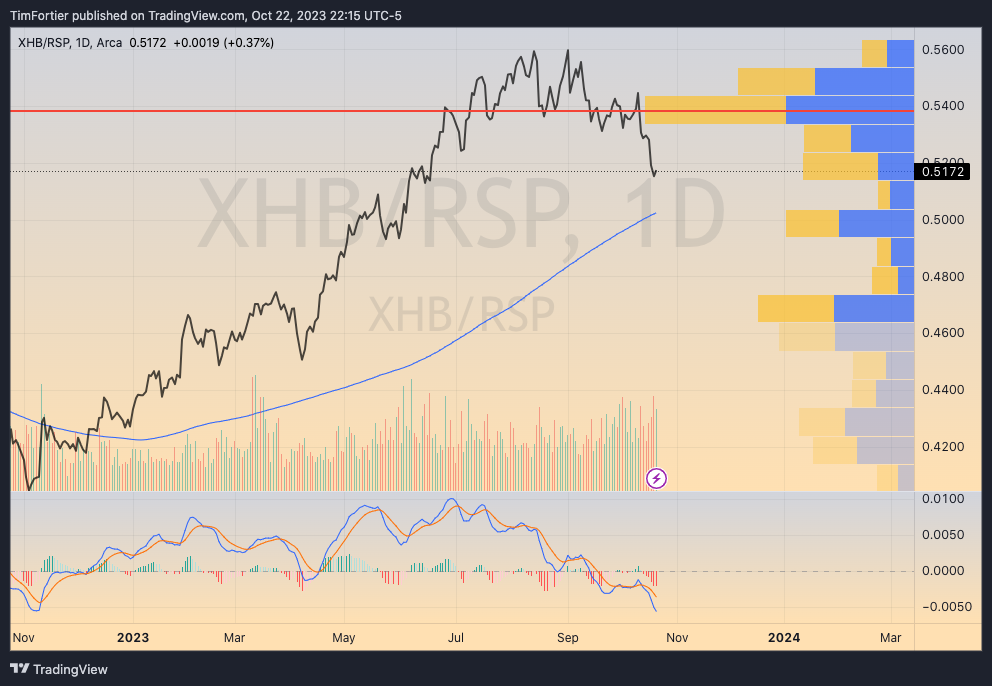
As this ratio chart demonstrates, housing stocks are now beginning to show more significant weakness than the general market.
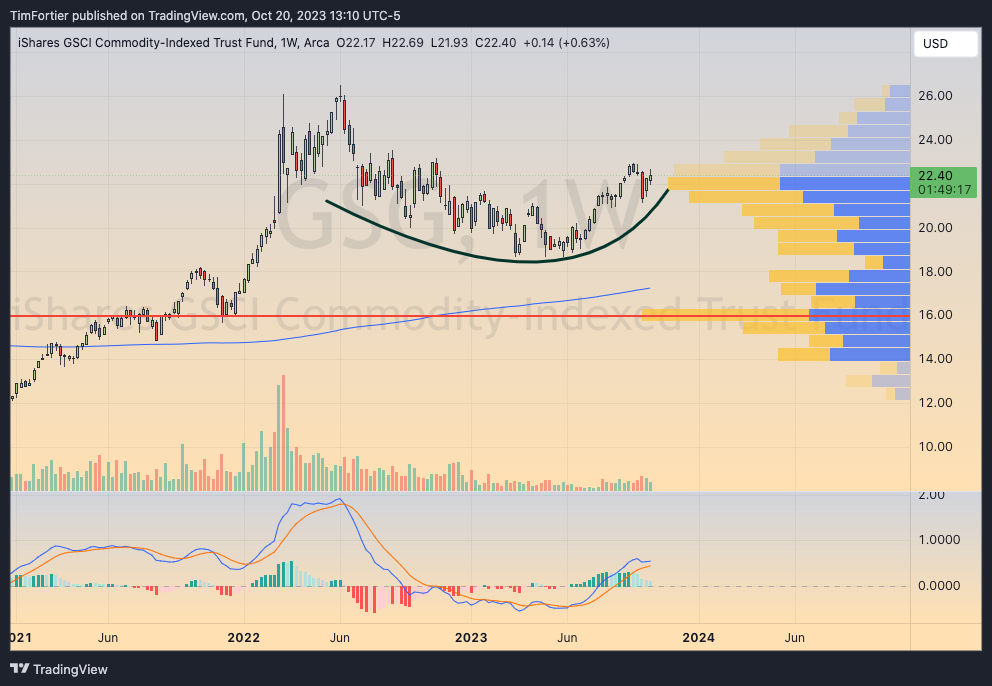
With gold and energy trending higher, commodities is the one asset category that remains positive.
Many are asking, “How much higher will rates go?”
I’ve seen a few economists and commentators attempt to call a top in rates.
The logic of those calling a top is that because core CPI has been falling, interest rates will follow.
After all, core CPI (excluding volatile energy and housing) is getting closer to Powell’s target of 2.5%.
But I will propose a different scenario… one where rates stay higher and for longer, regardless of where CPI is reported.
One only has to look at simple supply and demand dynamics to arrive at this conclusion.
The budget deficit is escalating out of control at an unsustainable pace.
Remember, interest rates are the opposite of bond prices.
As bond prices go lower, interest rates go higher.
The price of any security is controlled by supply and demand.
More supply than demand sends prices lower.
And right now, the U.S. government is having to flood the market with new bonds, and demand has been weaker than normal.
The U.S. Federal debt has increased at a rate of $2.2 trillion per year for the past 3.3 years. (since July 1, 2020).
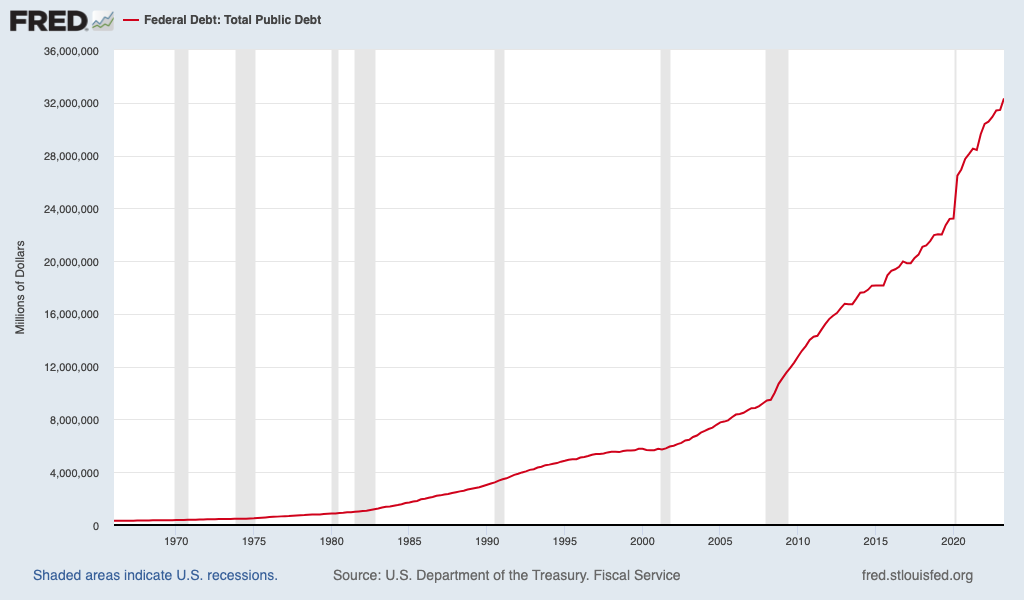
But since the debt ceiling was raised, the U.S. government has added an additional $1.8 trillion dollars… in a period of just 134 days!
At the current pace, this means that borrowings could reach nearly an additional $5 trillion in the course of a year.
This flood of selling is coming at a time when demand is weakening.
Barrons called the last Treasury auction for the 30-year paper “ugly,” and it was.
Primary dealers had to soak up 18.2% of the offering not taken by other bidders, much higher than the average 10.72%.
The Treasury also saw a weak auction recently for the 10-year and 3-year Treasuries.
That suggests there are fewer takers on government debt across various points on the curve.
So, with a massive supply of bonds hitting the market and lower demand, bond prices have been sinking to reach a rate to attract buyers.
And this has nothing to do with CPI.
“The problem is that we are on a path where the debt is growing substantially faster than the economy, and that, by definition, in the long run, is unsustainable.” ~ Jerome Powell
Tech Giant Earnings Today
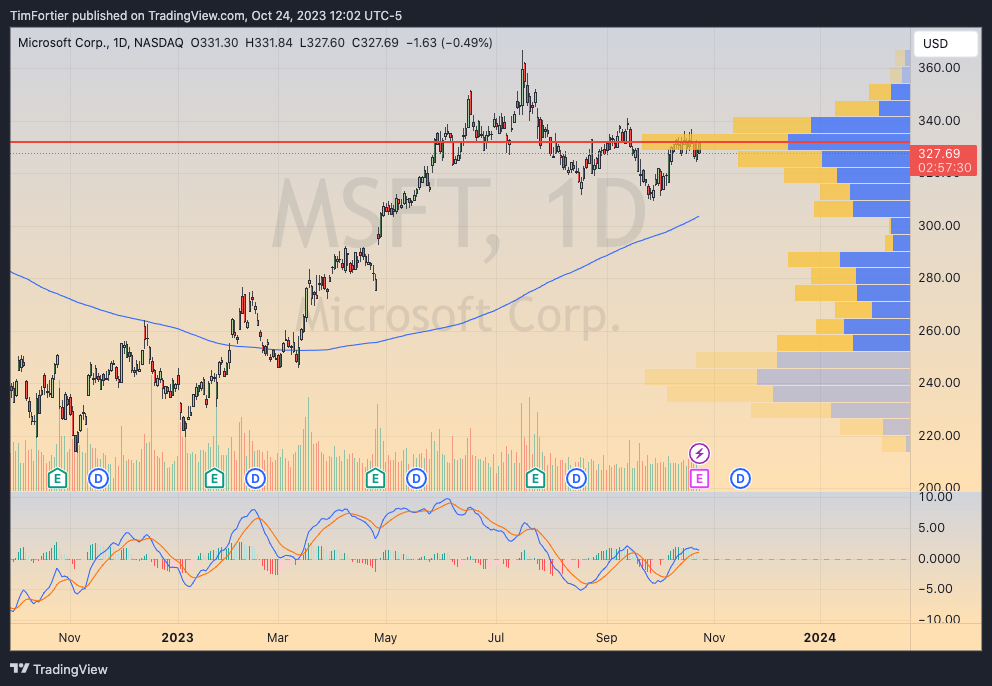
We have Microsoft and Alphabet reporting after the close today, with Amazon and Meta coming out later this week.
Microsoft is down about 10% from its July high of $366, currently trading at $328.
The $330 level represents a very important level, as indicated by the volume profile.
Moving over to Alphabet, the stock is trading right at $140, up from the most recent $128 low.
It’s important that the price stays within the rising trend channel.
In close, the price pattern in the major indices suggests that the decline may actually accelerate further to lower levels.
The weight of the evidence is decidedly bearish, and investors should currently be defensive.
Interest rates are on a solid trend higher and show no signs of reversing – there is no need to attempt to “predict a top.”
Supply and demand issues are unfavorable and may trump any other factor. (Note that the U.S. Treasury is selling 5-year and 7-year notes on Wednesday and Thursday respectively… how buyers bid on those auctions is going to be very important.)
Buckle up.
If you have any questions or have been considering hiring an advisor, then schedule a free consultation with one of our advisors today. There’s no risk or obligation—let's just talk.
Tags

Free Guide: How to Find the Best Advisor for You
Get our absolutely free guide that covers different types of advisory services you'll encounter, differences between RIAs and broker-dealers, questions you’ll want to ask when interviewing advisors, and data any good financial advisor should know about you and your portfolio.
