
Related Blogs
March 3, 2023 | Chris Rowe
Today we’re going to take a macro look at both savings and debt and what they may be signaling for investors…
Because too many American workers have seen their standard of living decline due to inflation.
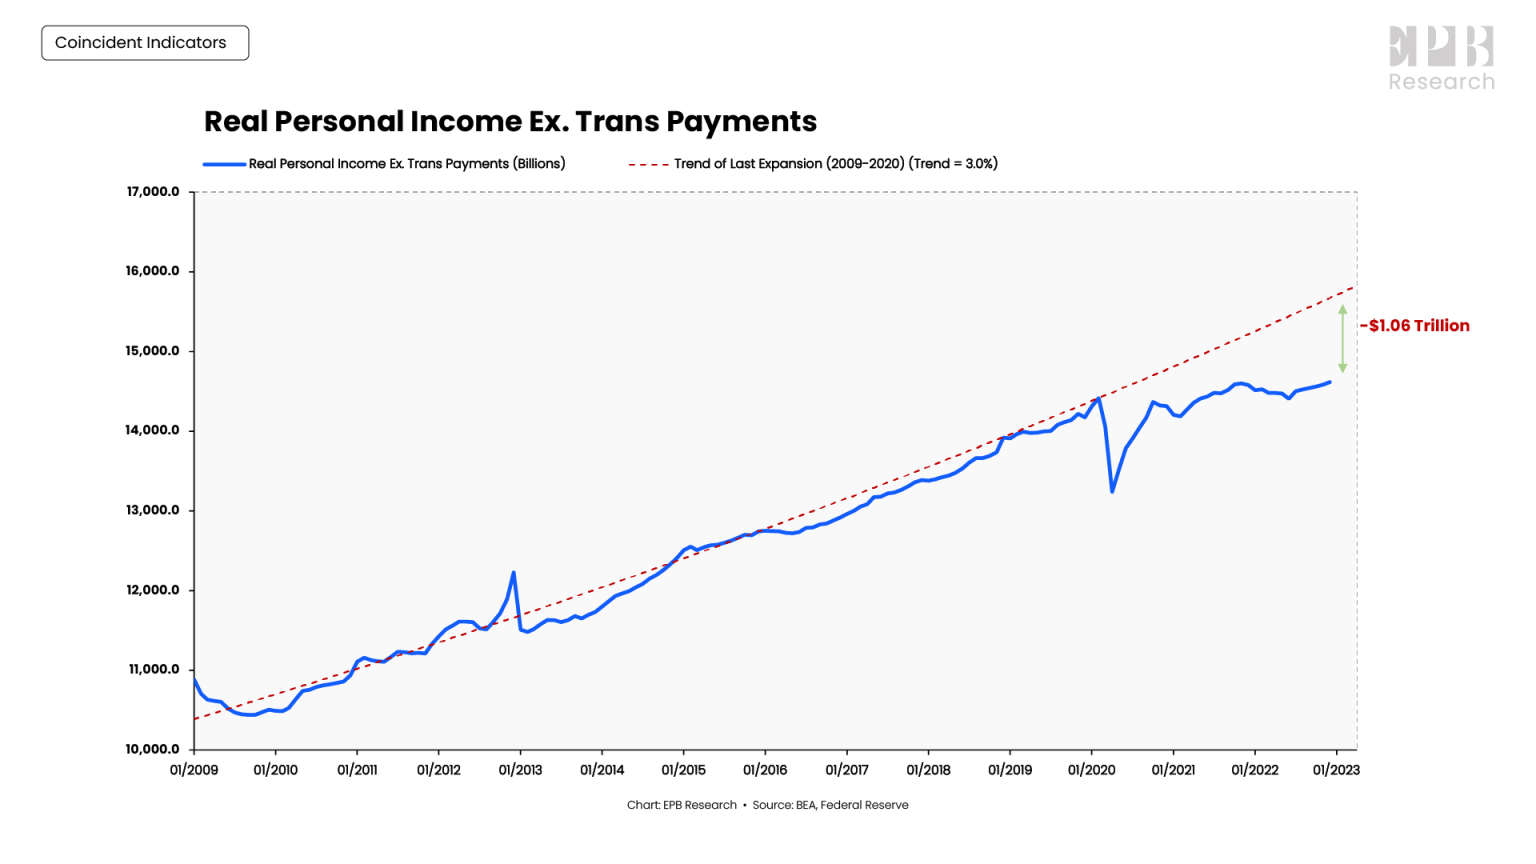
Over the last three years, many Americans witnessed a collapse in their standard of living as inflation outpaced income and left them over $1 trillion behind.
Let me explain.
Historically, personal income has risen by about 3% annually in real terms after adjusting for inflation. However, since February 2020, real private sector income has only increased by 0.5% per year.
The slower rate of growth in income amounts to a staggering $1T in personal income that left the consumers’ pocketbooks.
This massive gap between what actually happened after the pandemic and what workers were accustomed to is the exact reason why many people feel like they are falling behind, struggling to maintain their previous lifestyle and advancing through their family formation years.
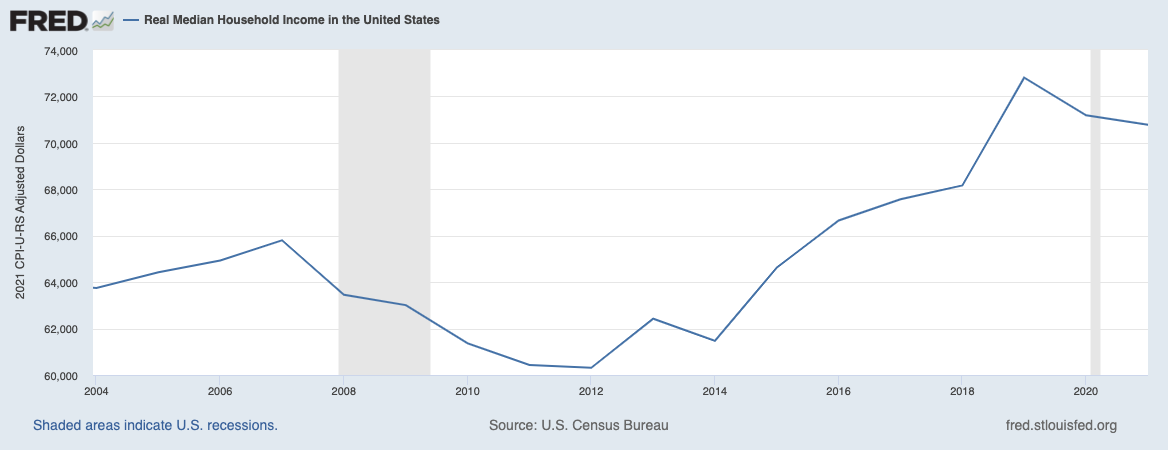
To look at it another way, Real Median Household Income has been falling over the past few years.
And where does this show? In savings and in credit.

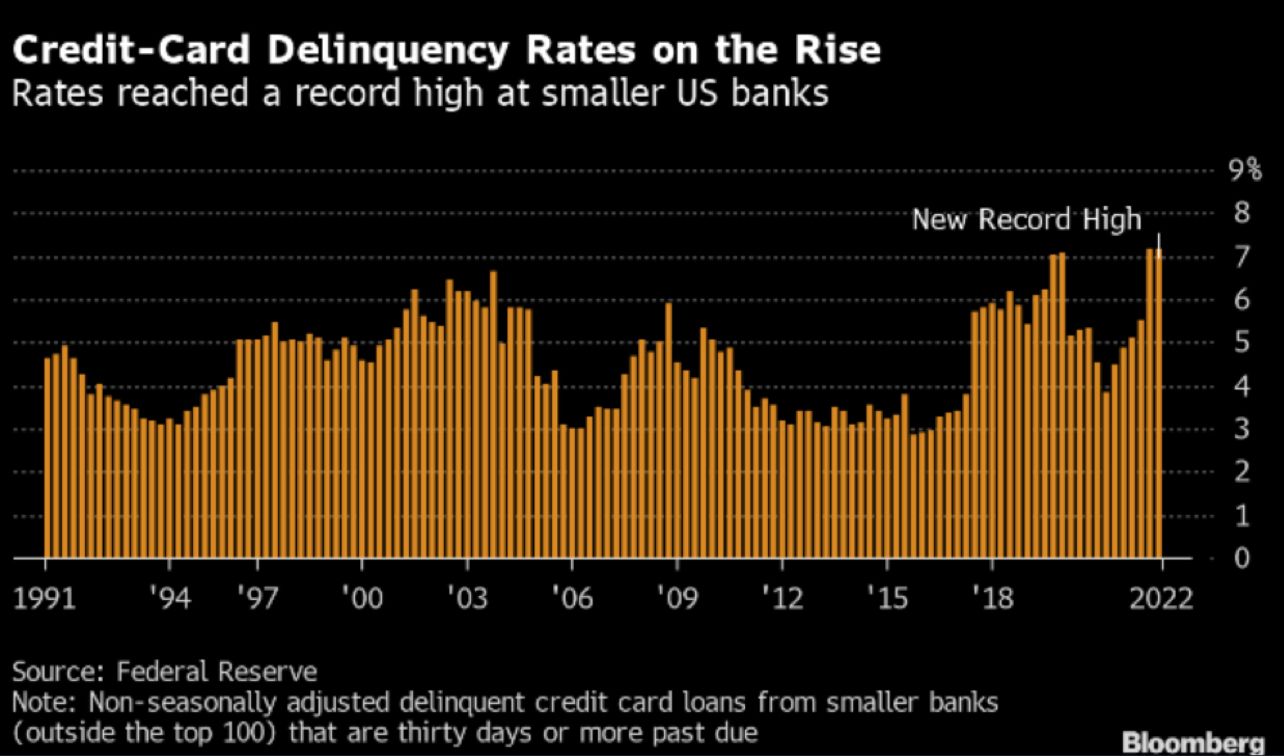
Savings rates have plummeted during this period as consumers have had to rely on savings to maintain a similar lifestyle. Concurrently, credit card delinquencies are rising.
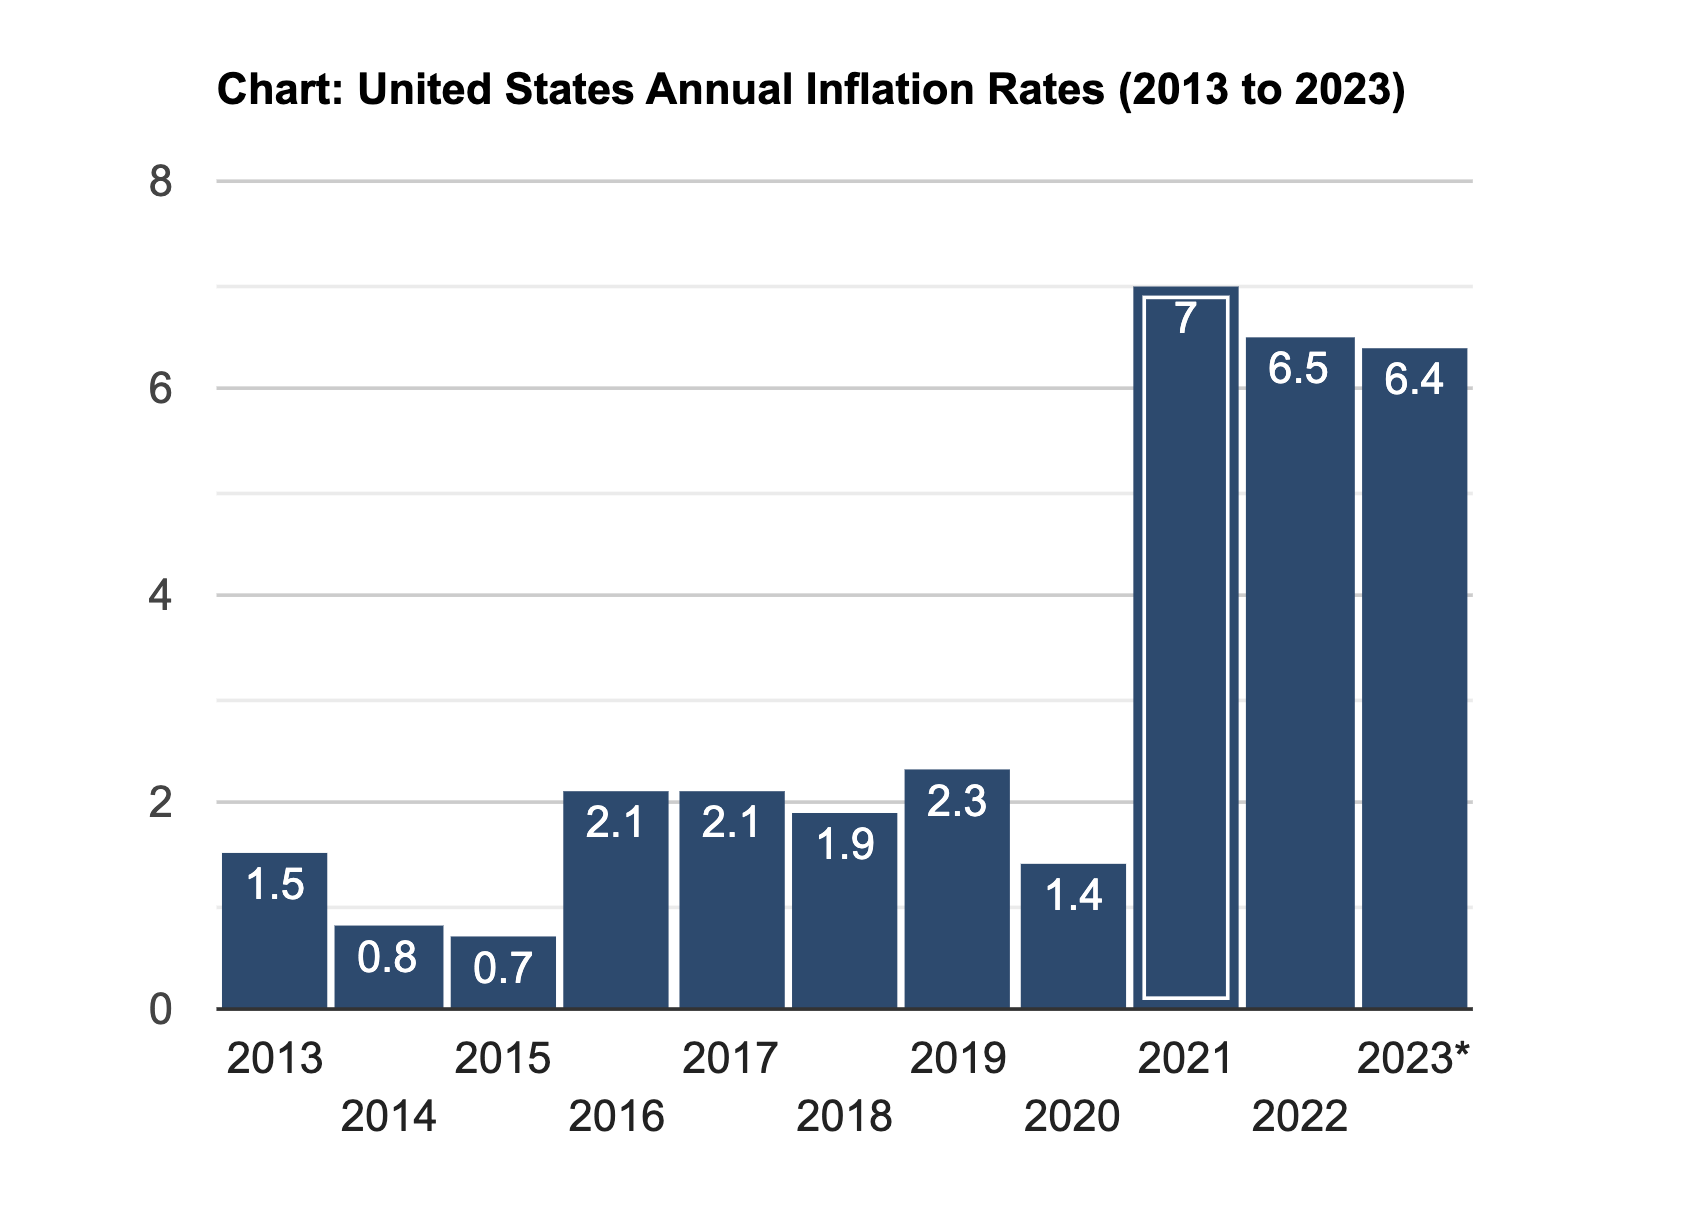
While the rate of change of inflation has begun to slow, it remains significantly higher and a pressure point on consumers.
While inflation has been a recent concern, there is another factor at work as well.
From 1960 to 2007, real private sector income increased by 3.3%. This includes the expansion years and the recession years. This is healthy income growth from a historical perspective.
Something changed after the 2000 recession. Income growth did not exceed 2.0% in the aftermath of the DotCom bubble and the 2008 housing crash.
After the COVID pandemic, we are down to less than 1% real income growth.
Why is the private sector becoming weaker and weaker, unable to come close to the historical 3% average?
Debt.
First is that as the level of debt in the economy increases, it strangles the capacity for new productive investments, which are the foundation for increases in worker productivity and real income gains.
Private debt is over 200% of GDP.

Now, add in public debt as a percentage of GPD which is currently around 120%.
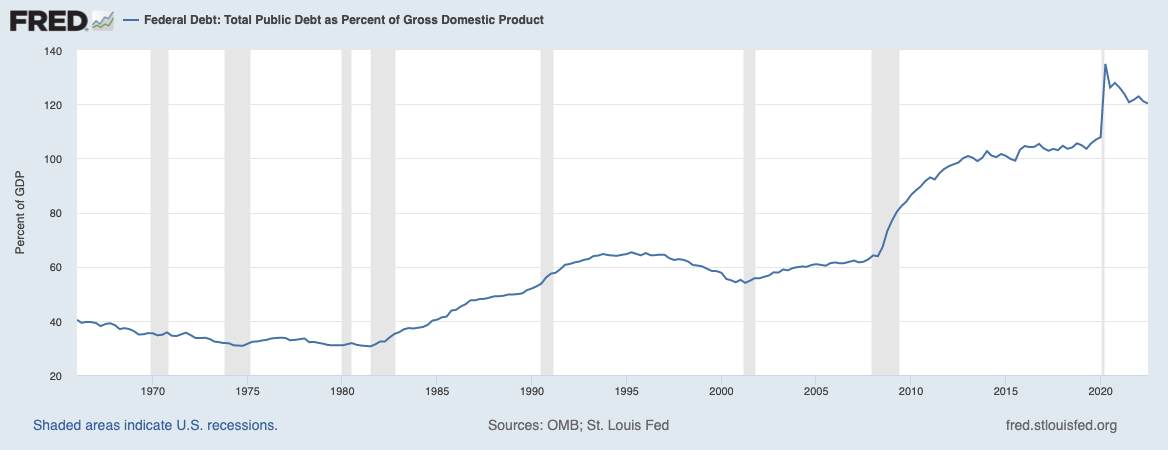
Collectively, public and private debt amount to nearly 350% of GDP!
Economist Lacy Hunt has used econometric research to persuasively demonstrate the statistical relationship between excessive debt and slow economic growth. What his research shows is that once a country’s public- and private-sector debt exceeds 275% of GDP, the relationship becomes non-linear, with growth slowing at an ever-increasing rate.
While investors have rejoiced with the recent increase in savings rates, remember that the interest expense associated with carrying debt is its carrying cost. And now that carrying cost is far more meaningful than when rates were near 0%.
Where this will likely have the greatest impact is in the private sector.
A negative link between high debt and investment is well established.
High corporate indebtedness implies higher interest expenses and thus less money available for investment. Firms with high debt also find it harder to obtain new funds from external sources due to their higher default risk.
Moreover, the desire to repair weak balance sheets leads firms to reduce their debt burden, and thereby forgo investment opportunities and new hiring.
Investor Implications
In the coming months, credit quality will likely become a significant factor as some companies will find it harder to place debt on attractive terms.
Corporate profits are at risk from rising interest costs, increasing labor costs, and raw goods costs to name just a few risks.
Indeed, corporate profits are beginning to recede.
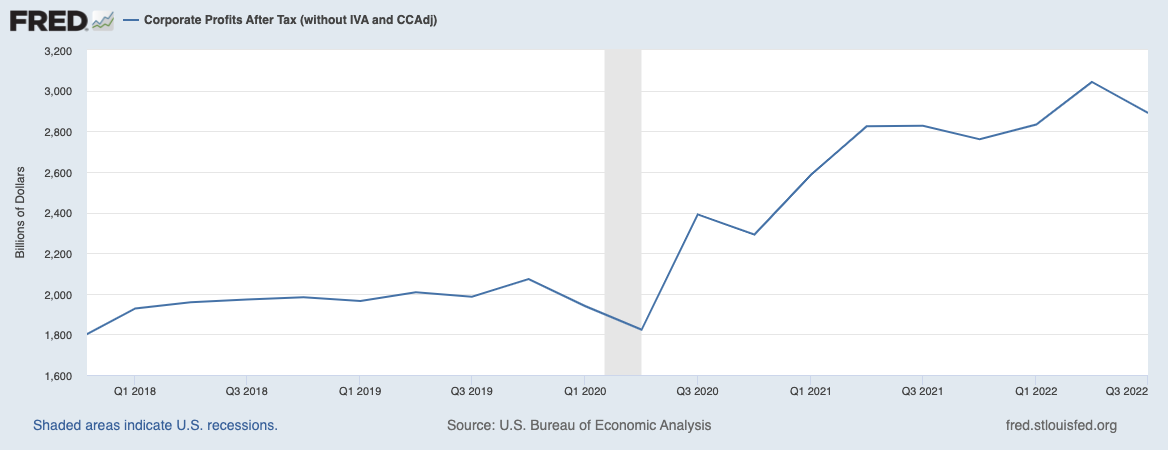
Additionally, with the consumer playing such a large role in the economy, the pressures of rising costs, layoffs, and diminished spending capacities place a serious question on future earnings growth.
If you have any questions or have been considering hiring an advisor, then schedule a free consultation with one of our advisors today. There’s no risk or obligation—let's just talk.
Tags

Free Guide: How to Find the Best Advisor for You
Get our absolutely free guide that covers different types of advisory services you'll encounter, differences between RIAs and broker-dealers, questions you’ll want to ask when interviewing advisors, and data any good financial advisor should know about you and your portfolio.
