
Related Blogs
September 1, 2021 | Michael Reilly
 Even in frustrating, range-bound, and choppy markets like the ones we’ve been “blessed” with since early February, there are often bright spots… if you just know how to find them.
Our research team has uncovered one specific – and potentially profitable – investment opportunity that could change the way you allocate some of your hard-earned investment dollars starting today.
There is one sector where demand is quietly taking control… the question is: Is this the start of the next big move?
Following COVID’s assault on global economies, a lot of commodity-based assets have made huge moves to the upside.
It’s a classic case of supply meets demand… or in this case, demand outstrips all available supply.
We see this in the near parabolic moves higher from many commodity-centric sectors, including the one you’ll hear more about now – it’s soared almost straight up….
Now keep in mind, moves like this only happen when buyers are so charged up that they are willing to pay to play.
This was certainly the case for building materials, like Steel/Iron.
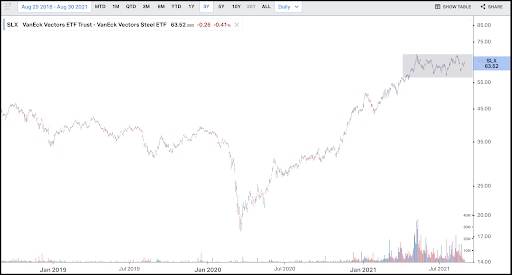
The Vaneck Vectors Steel ETF (SLX) shot up 267% between March 23, 2020 and May 10, 2021 confirming that supply could not keep up with demand.
I don’t have to tell you how disappointing it can be to hear about a profitable opportunity AFTER it happened.
The only reason you’re hearing about it now is that, every once in a while, we do indeed get a second chance.
Right now, the Steel/Iron sector appears to be rounding an important corner. For the last three months, Steel – using SLX as a market proxy – has made little to no progress (see the grey highlight below)…
And that just may translate into an opportunity for investors like you.
Here’s the deal: Nothing goes up in a straight line. Even the strongest sectors and stocks need a break – a time to digest their gains before deciding what’s next.
It’s like gorging on a Thanksgiving feast and needing an hour before having room for that slice of apple pie…
SLX has been digesting. But based on the charts you’re about to see, the Steel/Iron sector has caught its proverbial breath, and may now be ready to give you the chance you may have missed before.
Let me explain: We know the Biden administration has been working behind the scenes, negotiating a multi-trillion dollar infrastructure deal with both sides of the aisle.
The final plan has yet to emerge, but two things are for sure…
1.) It’s going to be big, and…
2.) It’s going to take time.
This hasn’t been lost on many of the biggest hedge funds and institutions around the world – the people considered “the smart money” by many.
These players are well aware of the long-term implications of the passage of a multi-trillion dollar plan and how to profit from it… with or without you.
And believe me, they’re more than happy to keep the profits all to themselves and leave you behind in the dust.
It’s up to every investor to figure out what kind of move is right for them to make in a pivotal moment like this one.
At Rowe Wealth Management, the cornerstone of our investment process is Relative Strength (RS). RS Investing compares one stock, sector, or asset class to another – looking for a signal, an edge, that will direct us to an area of the market that’s exhibiting exceptional demand from big institutional players… because they’re actually driving market prices higher and lower with their decisions.
Our process includes the use of Point and Figure charts – P&F for short. What we’re looking for is a significant rise in demand that can cause prices to rise. And P&F charts help us spot that trend.
Let’s stick with the Vaneck Vectors Steel ETF (SLX), as an example. SLX made an important move recently – moving back to a column of Xs, indicating demand has wrestled control of the sector away from supply (sellers).
CHEAT CODE: A column of Xs indicates demand or buying is in control of the stock/sector, pushing prices higher. A column of Os indicates selling is in control of the stock or sector you are viewing – that selling or supply pushes prices lower.
Take a look at the chart below. It’s the BPI or Bullish % Index of the Steel/Iron sector. It currently indicates that 65.22% of all stocks trading in this sector are on a P&F Buy signal on their own charts. That’s a positive development for anyone interested in investing in the Steel sector.
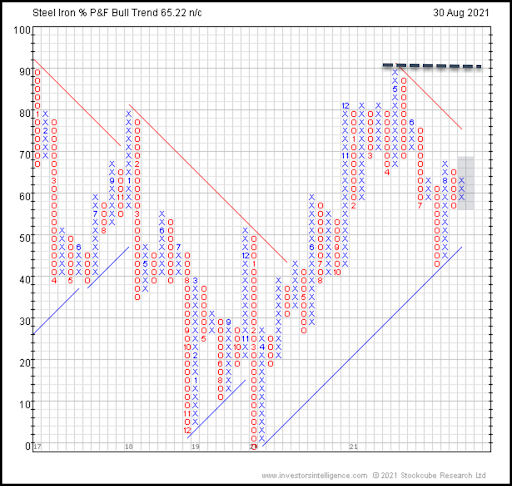
The sector has seen as many as 90% of Steel/Iron stocks on a buy signal, so there’s plenty of room for this group of stocks to advance higher.
Need more proof? Take a look at the chart below. This chart is an RS chart. It compares the strength of the Steel/Iron sector to the broader stock market – specifically, the equally weighted S&P 500 index.
RS studies will tell you that investing in stocks exhibiting relative strength vs. the broader stock market can lead to market-beating returns.
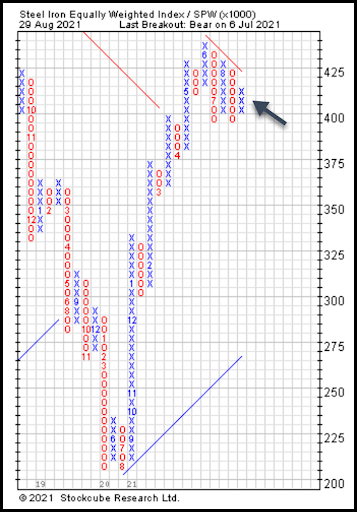
Do you see the column of Xs marked with an arrow? That’s your signal indicating that the Steel/Iron sector is flexing its muscles – showing strength vs. the broader stock market.
So, how do you play this emerging trend?
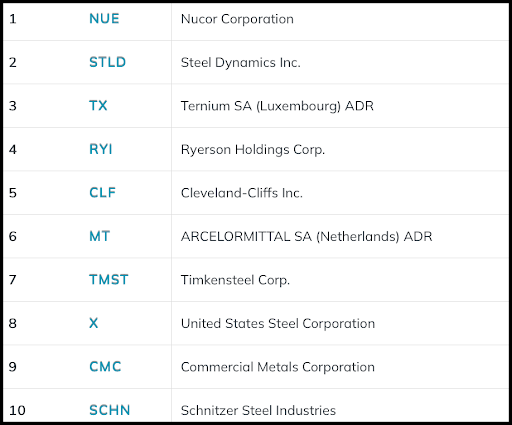
Here is a list of some individual stock names investors can consider – ranked in order of relative strength.
For those investors interested in a more diversified alternative, here are two ETFs to consider. The Vaneck Vectors Steel ETF (SLX) or the SPDR S&P Metals and Mining ETF (XME).
We’ll be sure to keep you updated on the strength of this sector as the infrastructure deals continue to unfold.
Stay tuned for more… until then, invest wisely.

PS: It’s that time of the year again. We are once again opening the doors to new investors who have investment portfolios valued over $500,000. If you’d like to schedule a free 1-hour consultation to review your portfolio. Click here to schedule a free consultation.
Through relative strength analysis, we uncover the strongest asset classes, sectors, and industry groups that are in uptrends and showing the potential for continued profits.
As an investor, your success and profits are often tied to your ability to adapt to ever-changing market conditions – and to the asset classes and sectors attracting the most institutional demand.
And that’s what ADAPT Weekly has set out to do – highlight market changes and give investors like you an edge, and the opportunity to profit tactically from what’s working and what’s not.
Tags

Get Our FREE Guide
How to Find the Best Advisor for You
Learn how to choose an advisor that has your best interests in mind. You'll also be subscribed to ADAPT, Avalon’s free newsletter with updates on our strongest performing investment models and market insights from a responsible money management perspective.
