
Related Blogs
August 16, 2023 | Avalon Team
Last week, I sent out a video highlighting the major differences between the first half of 2023 and what is already different in the second.
It’s only 15 minutes and well worth your time, so have a look.
Today, I’m going to highlight what I think are a few of the most important charts and changes investors need to be aware of.
We’ll begin with a look at the price chart of the Nasdaq 100 (QQQ) and the S&P 500 index because they tell the story.
Markets bottomed in October of 2022 and went on to have a pretty historic run until July 2023. That’s when things changed.
What changed? Both the QQQs and SPX slammed right into overhead resistance at the October 2021 highs and have failed to break out.
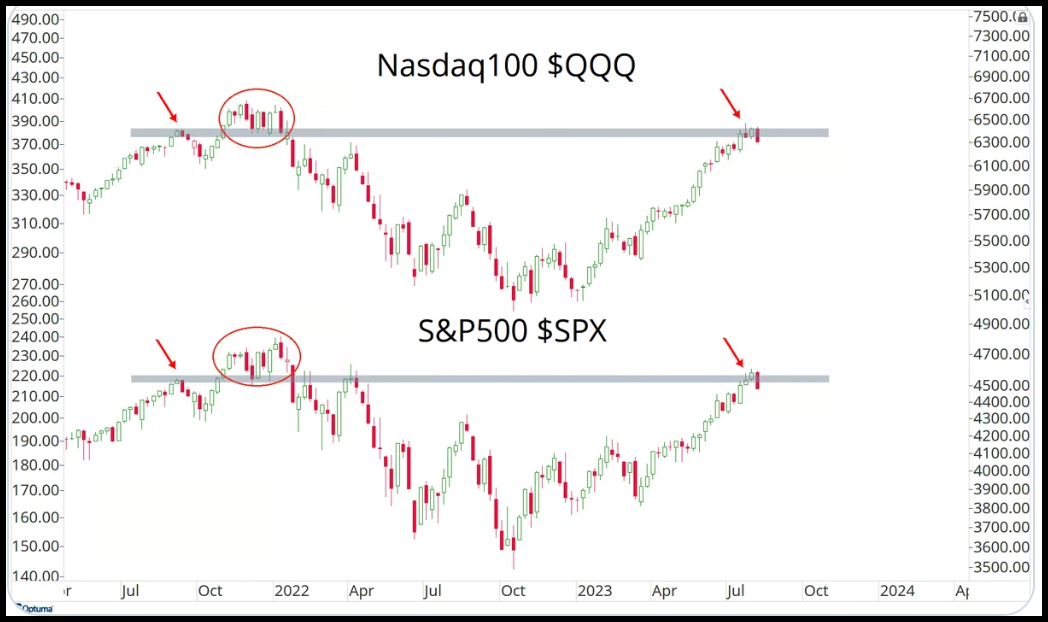
So until there’s a decisive break above that former resistance, I wouldn’t expect the indexes to show much further upside from here.
Nearly 30% of the S&P 500 index and 51% of the Nasdaq 100 are Technology stocks.
So if Tech is struggling – and it is – you’ll see it in the indexes… and you are!
Here’s Technology (XLK) struggling up against former overhead resistance, just like QQQ and SPX.
That’s no coincidence.
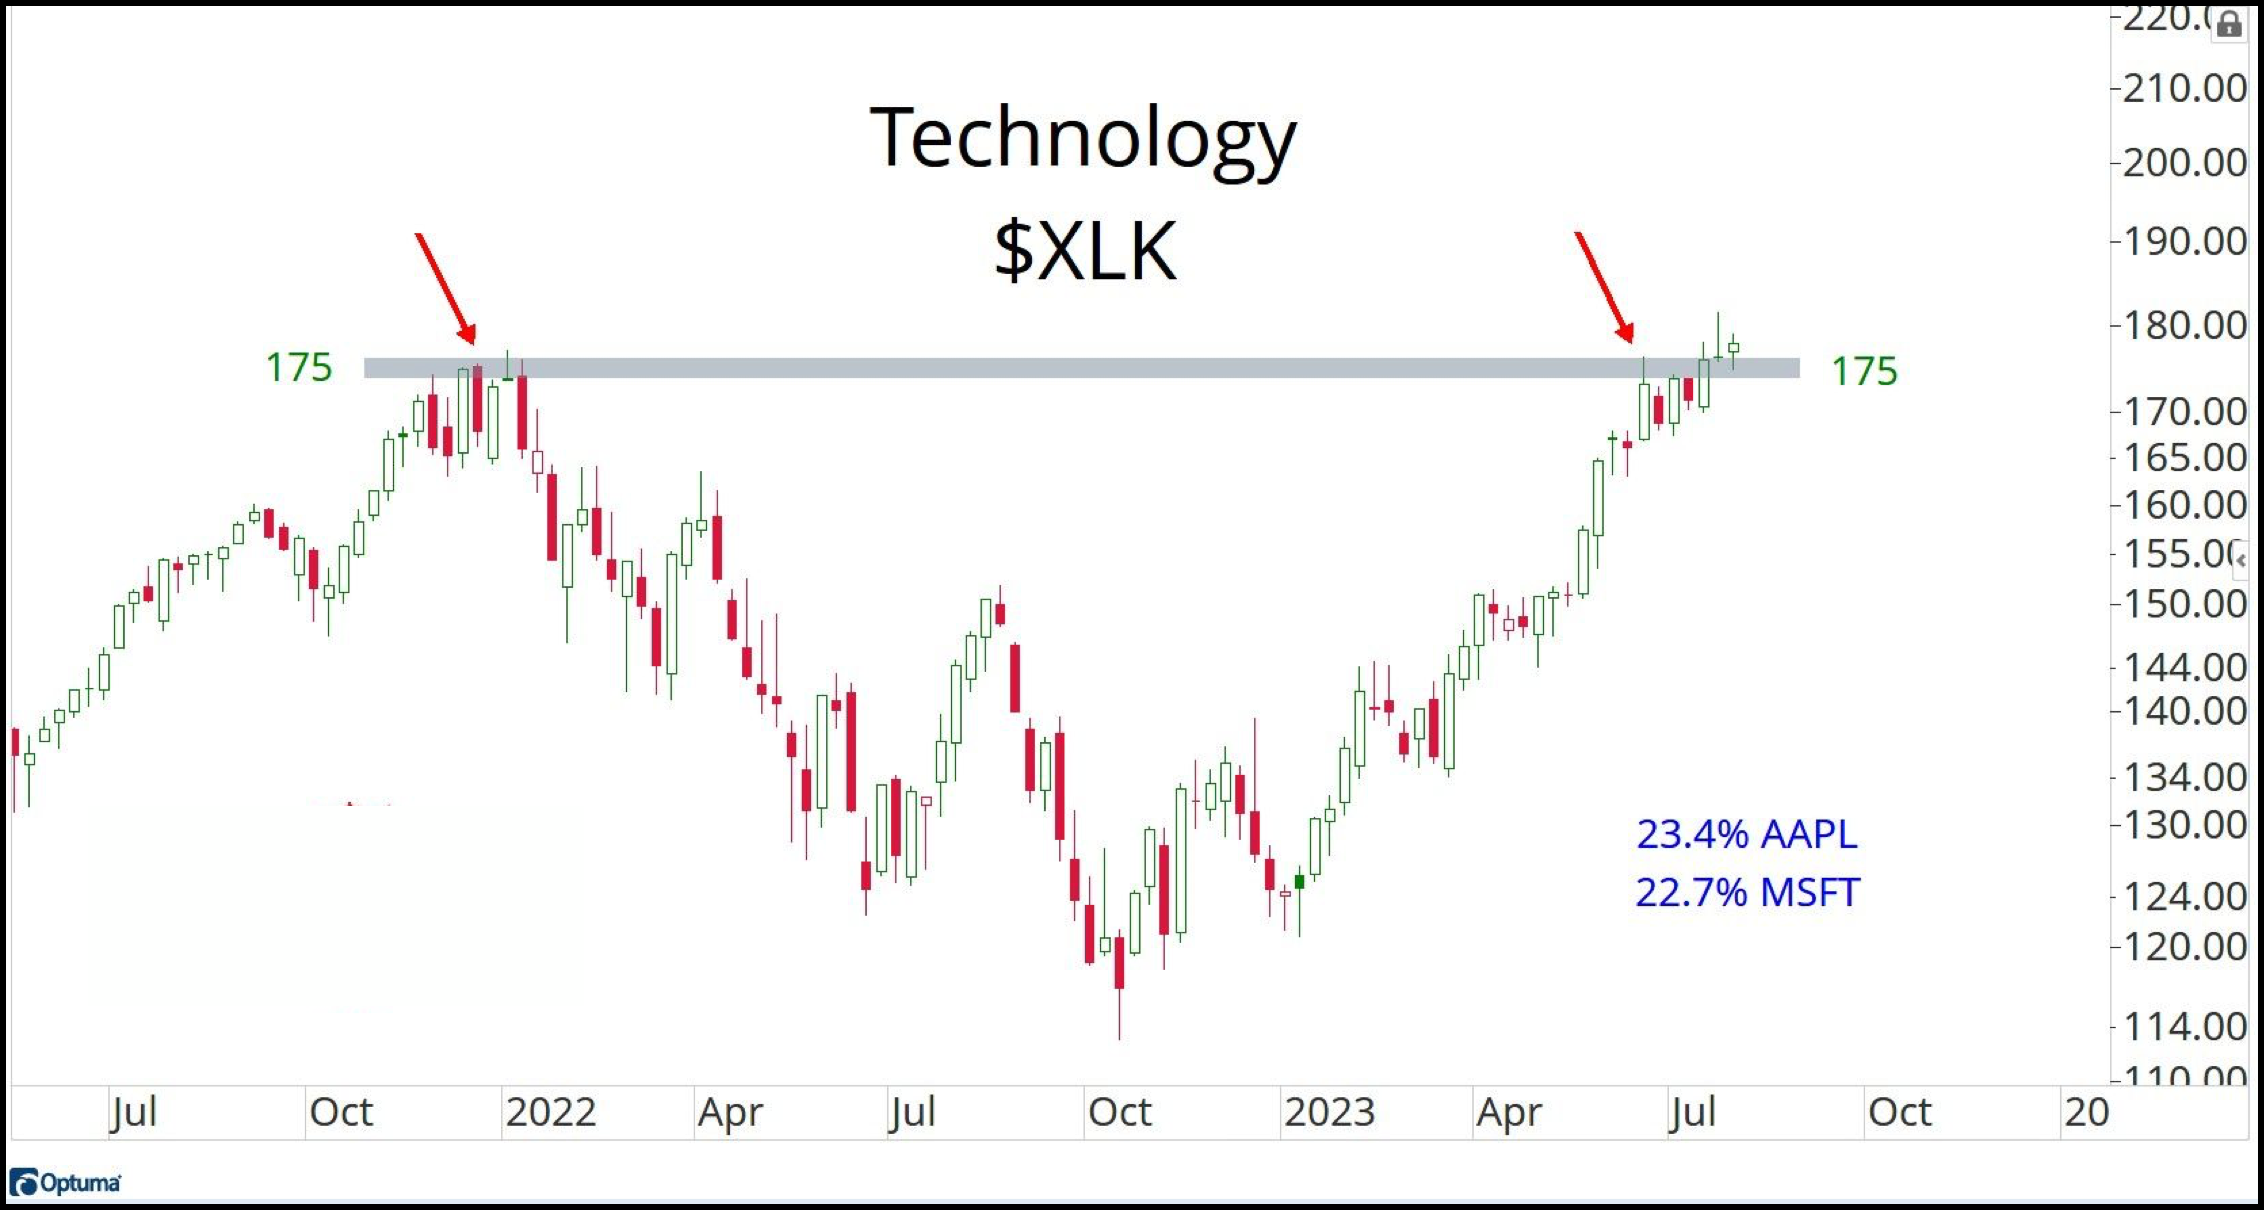
XLK is a bit of a proxy for AAPL and MSFT, as these two stocks represent 46% of this sector fund. So, as these two behemoths go, so goes XLK.
To make our point about the Tech sector’s struggles coming into the second half, here’s equally weighted Tech running into resistance at the October 2021 highs, just like the cap-weighted Tech.
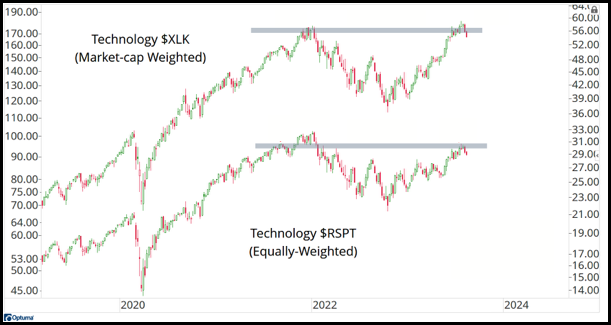
Notice Technology on both a cap-weighted and equally weighted basis looks very different than it did coming off the October 2022 lows as they get turned away at former highs for the first time since the breakout.
I keep pounding the table about it – don’t miss this point!
The second half of 2023 is shaping up to look much different than the first half and we can identify one of the culprits – Technology.
Moving on…
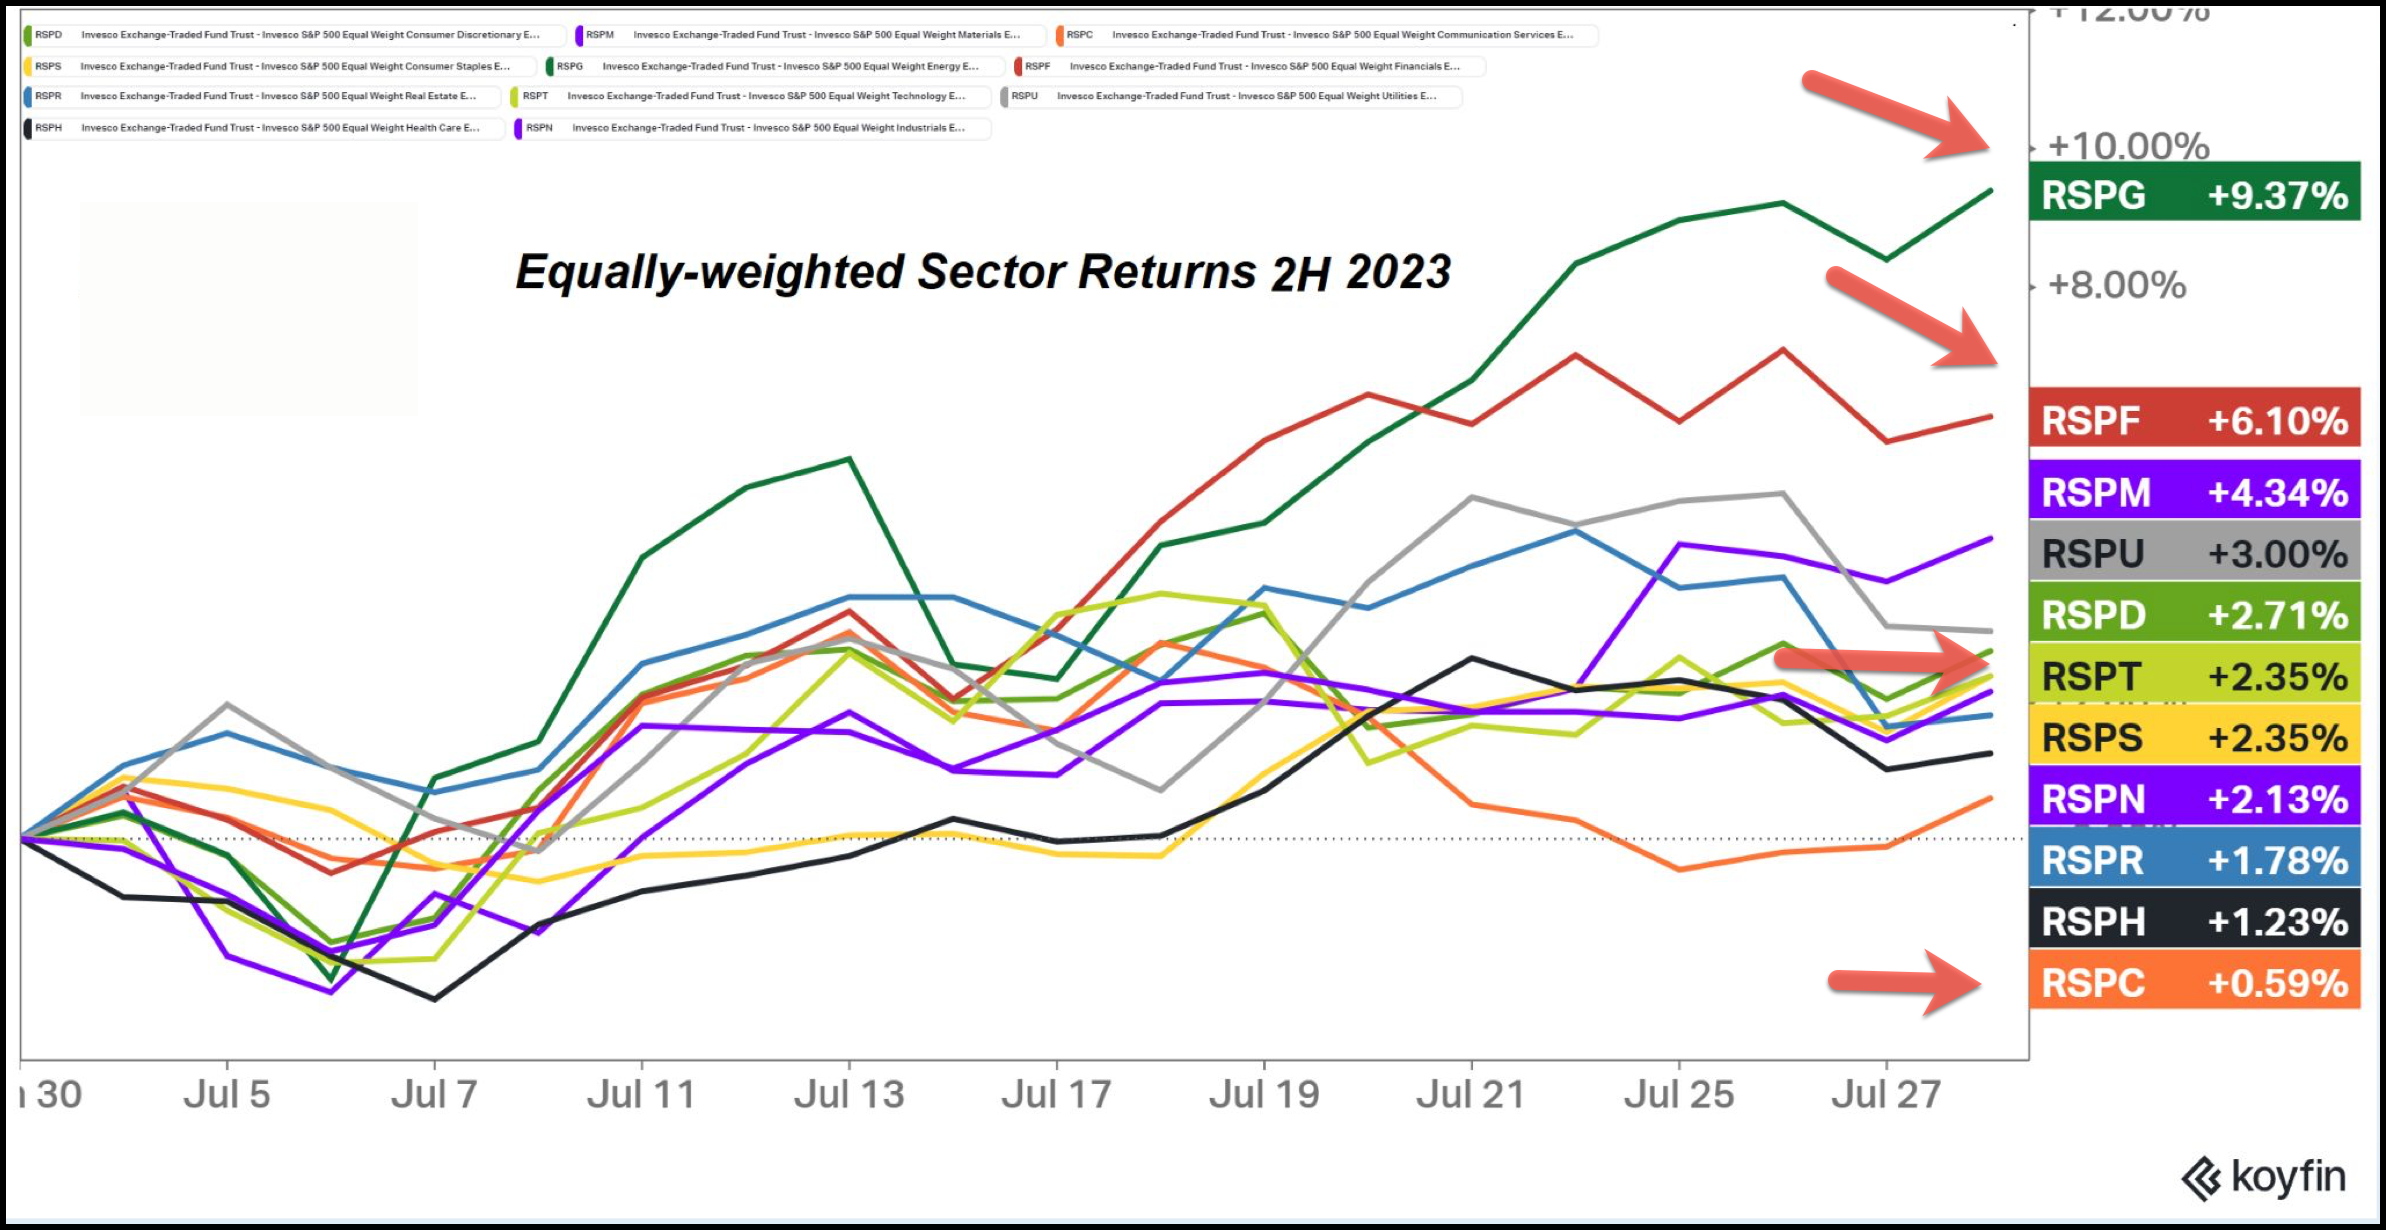
We continue to see a rotation take place on the sector level from the first-half leaders. Technology, Communications, and Consumer Discretionary stocks are the laggards here in the second half.
July 1, 2023 marked the beginning of the second half, and investors have seen rotation out of growth stocks into value with Energy, Financials, and Materials taking the lead.
The first-half winners have failed to keep pace.
And just to reiterate, Tech makes up 28.8% of the S&P 500, while Energy is 4% and Materials represents only 2% of the index.
The Nasdaq 100 holds 51.3% Tech, 0% Energy, and 0% Materials.
So there should be no surprise as to why your favorite index has been disappointing you – and will continue to do so – as long as those large-cap growth sectors struggle versus value sectors like Energy and Materials.
We often discuss Relative Strength (RS) around here as a means to identify strengths and weaknesses in markets and sectors.
Here’s an RS chart comparing the Tech sector (XLK) to Energy (XLE).
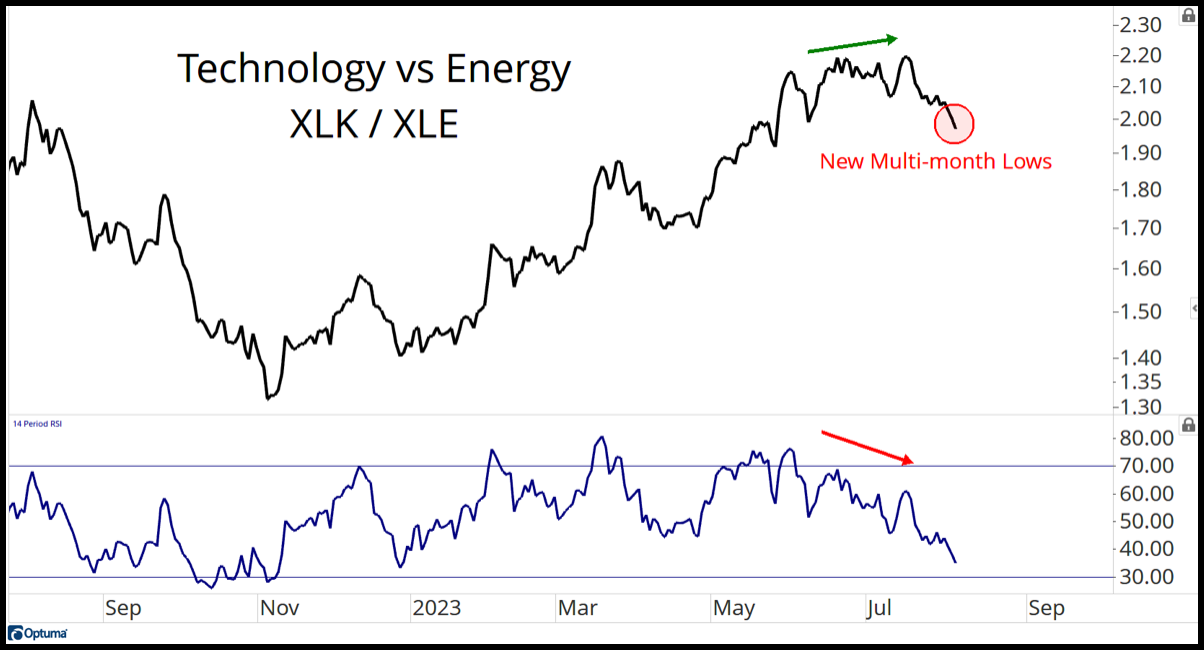
The RS ratio line was moving up since the October/November lows, pointing to outperformance in Tech over Energy.
That relationship has now rolled over as Tech is no longer making new RS highs versus Energy.
In fact, money is flowing out of Tech and into Energy.
Bottom line: Sector rotation is occurring and value stocks currently offer better upside potential than some of the growthy areas.
How long will it last? I don’t know.
I can’t say for sure when growth will reverse higher, but I’d bet the large-cap growth indexes of the NASDAQ and S&P 500 will continue to struggle until the U.S. Dollar weakens once again.
We know the dollar and the S&P 500 have maintained a negative correlation – meaning that when the dollar is weak, stocks tend to do well and when the dollar is strong, stocks struggle.
Here’s a chart of the Dollar index (DXY).
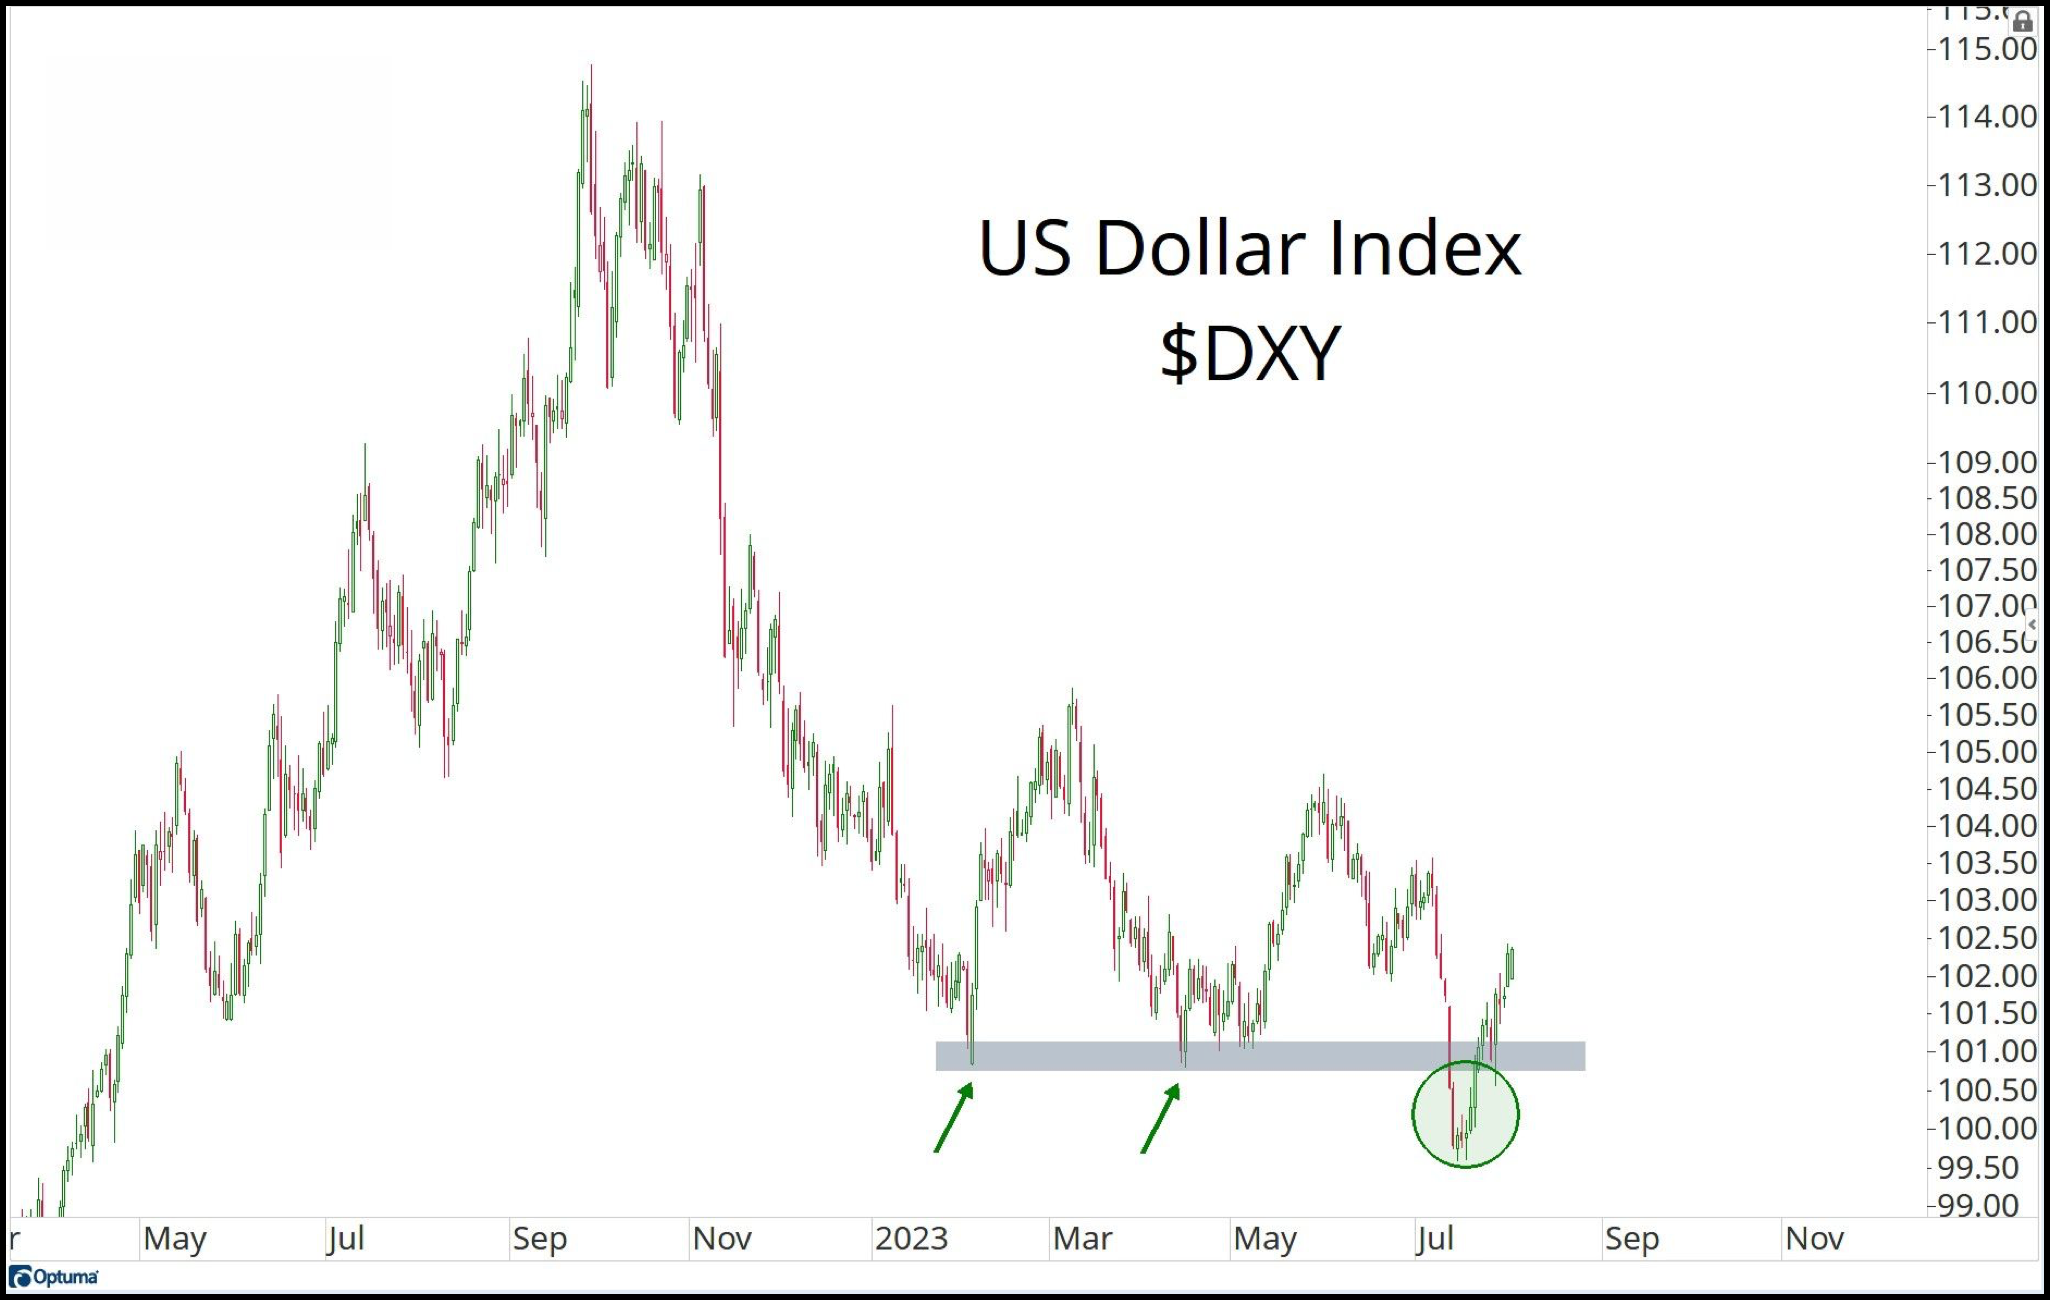
The dollar bottomed in July, showing renewed strength right at the same time growth stocks began to struggle. Again, there is no coincidence here.
As long as the dollar continues to strengthen, I’d expect indexes and growth sectors to struggle. The most bullish thing that could happen for growth stocks right now is the dollar rolling over.
I just wouldn’t count on it happening right now.
I’ll sum it up for you: The second half is shaping up to look very different than the first half. If you don’t adapt to these changes, you risk getting left behind.
If you have any questions or have been considering hiring an advisor, then schedule a free consultation with one of our advisors today. There’s no risk or obligation—let's just talk.
Tags

Free Guide: How to Find the Best Advisor for You
Get our absolutely free guide that covers different types of advisory services you'll encounter, differences between RIAs and broker-dealers, questions you’ll want to ask when interviewing advisors, and data any good financial advisor should know about you and your portfolio.
