
Related Blogs
March 12, 2024 | Avalon Team
Within the leading Technology Sector Fund (XLK), the semiconductor industry has been the leading group on a YTD performance basis.

And among the semiconductor stocks, NVIDIA has been the clear winner among the large caps, as indicated by the table showcasing the year-to-date performance of the leading semiconductor stocks.

NVIDIA’s impressive YTD gain of over 70% has helped lift the entire industry group. So much so that the ratio of semiconductors to the S&P 500 is at an all-time high.
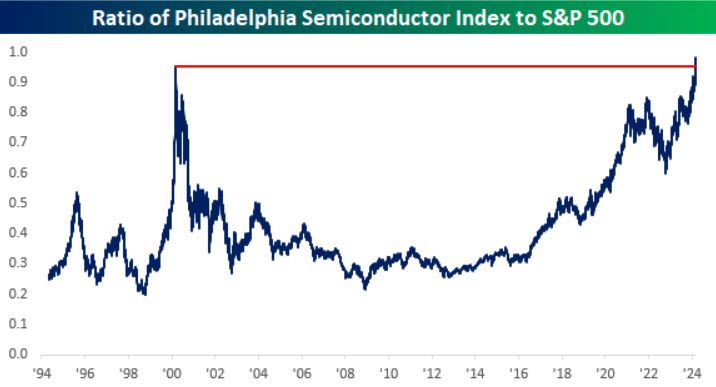
While this in itself is not necessarily a “sell signal,” it should cause investors to pause and reflect on the current manic obsession to own this group of stocks.
At a minimum, know where the exit is if they yell “fire” in this crowded theatre.
Which brings me to the recent bearish engulfing pattern in NVIDIA stock.
The Bearish Engulfing pattern is a two-candlestick pattern that consists of an up (white or green) candlestick followed by a large down (black or red) candlestick that surrounds or “engulfs” the smaller up candle.
Looking at the chart of NVIDIA, we can see this exact pattern was recently completed.
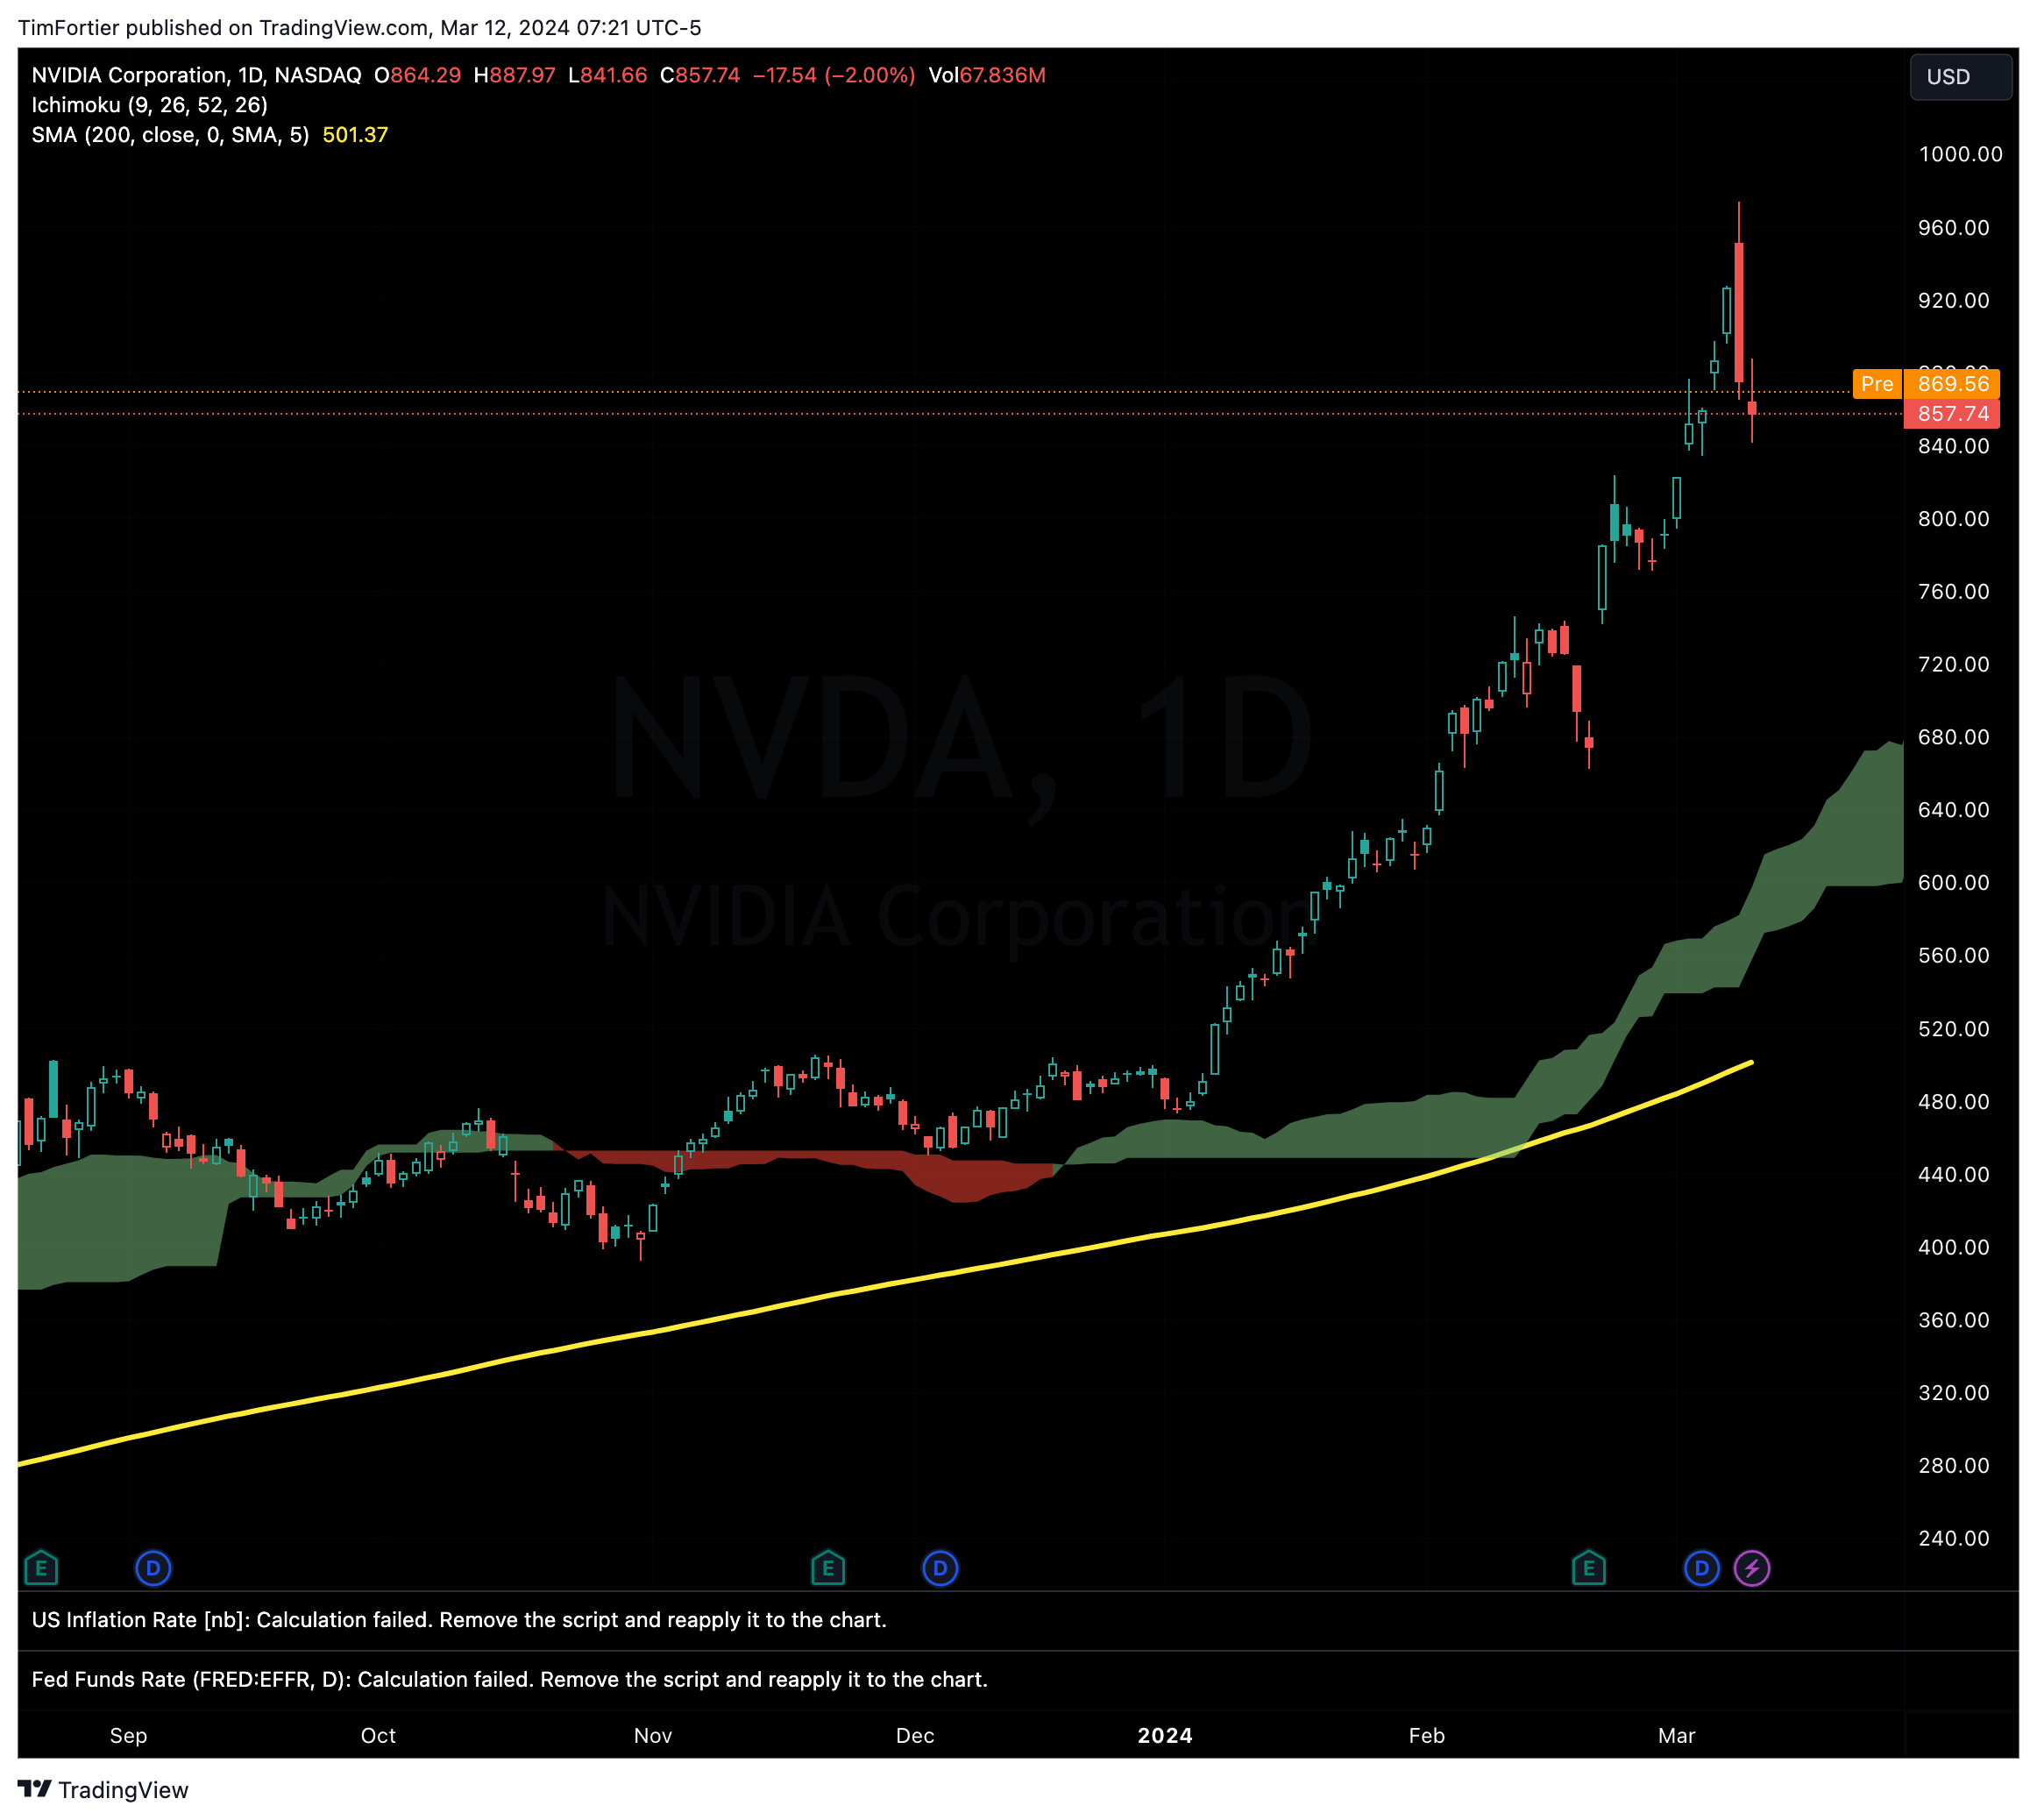
What now?
To be clear, a bearish engulfing pattern is a two-bar candle pattern indicating short-term distribution and negative sentiment.
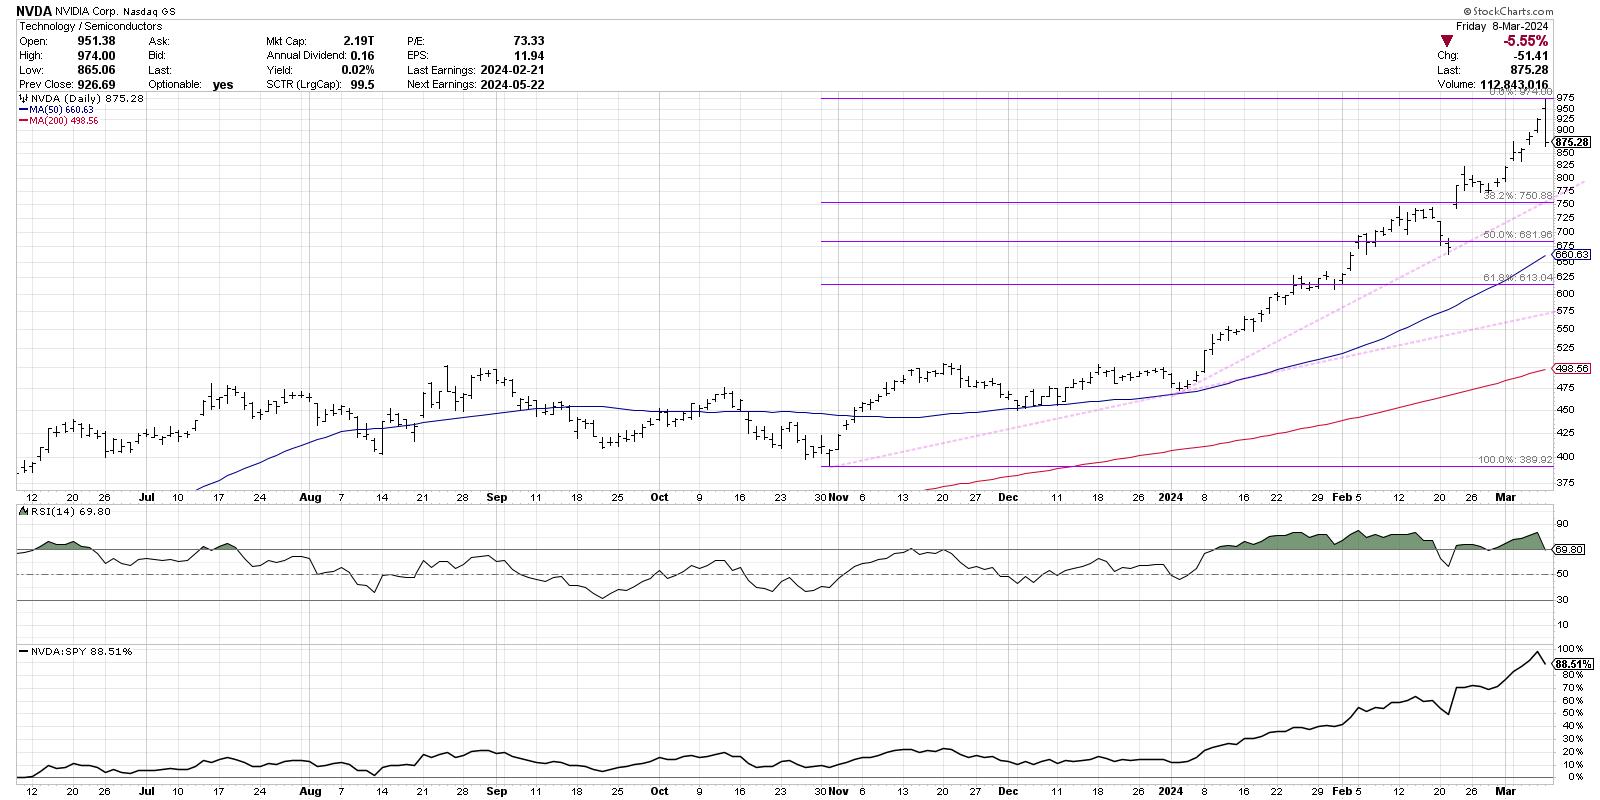
A quick Fibonacci analysis would suggest an initial downside target of around $750, which would represent a 38.2% retracement of the October 2023 low to the recent high of around $975. The 50-day moving average also lines up well with the 50% retracement level around $682, giving additional emphasis to this as a potential downside support level.
Beyond NVIDIA, shares of Broadcom (AVGO), another leading stock within the semiconductor industry are also showing signs of distribution after its big run.
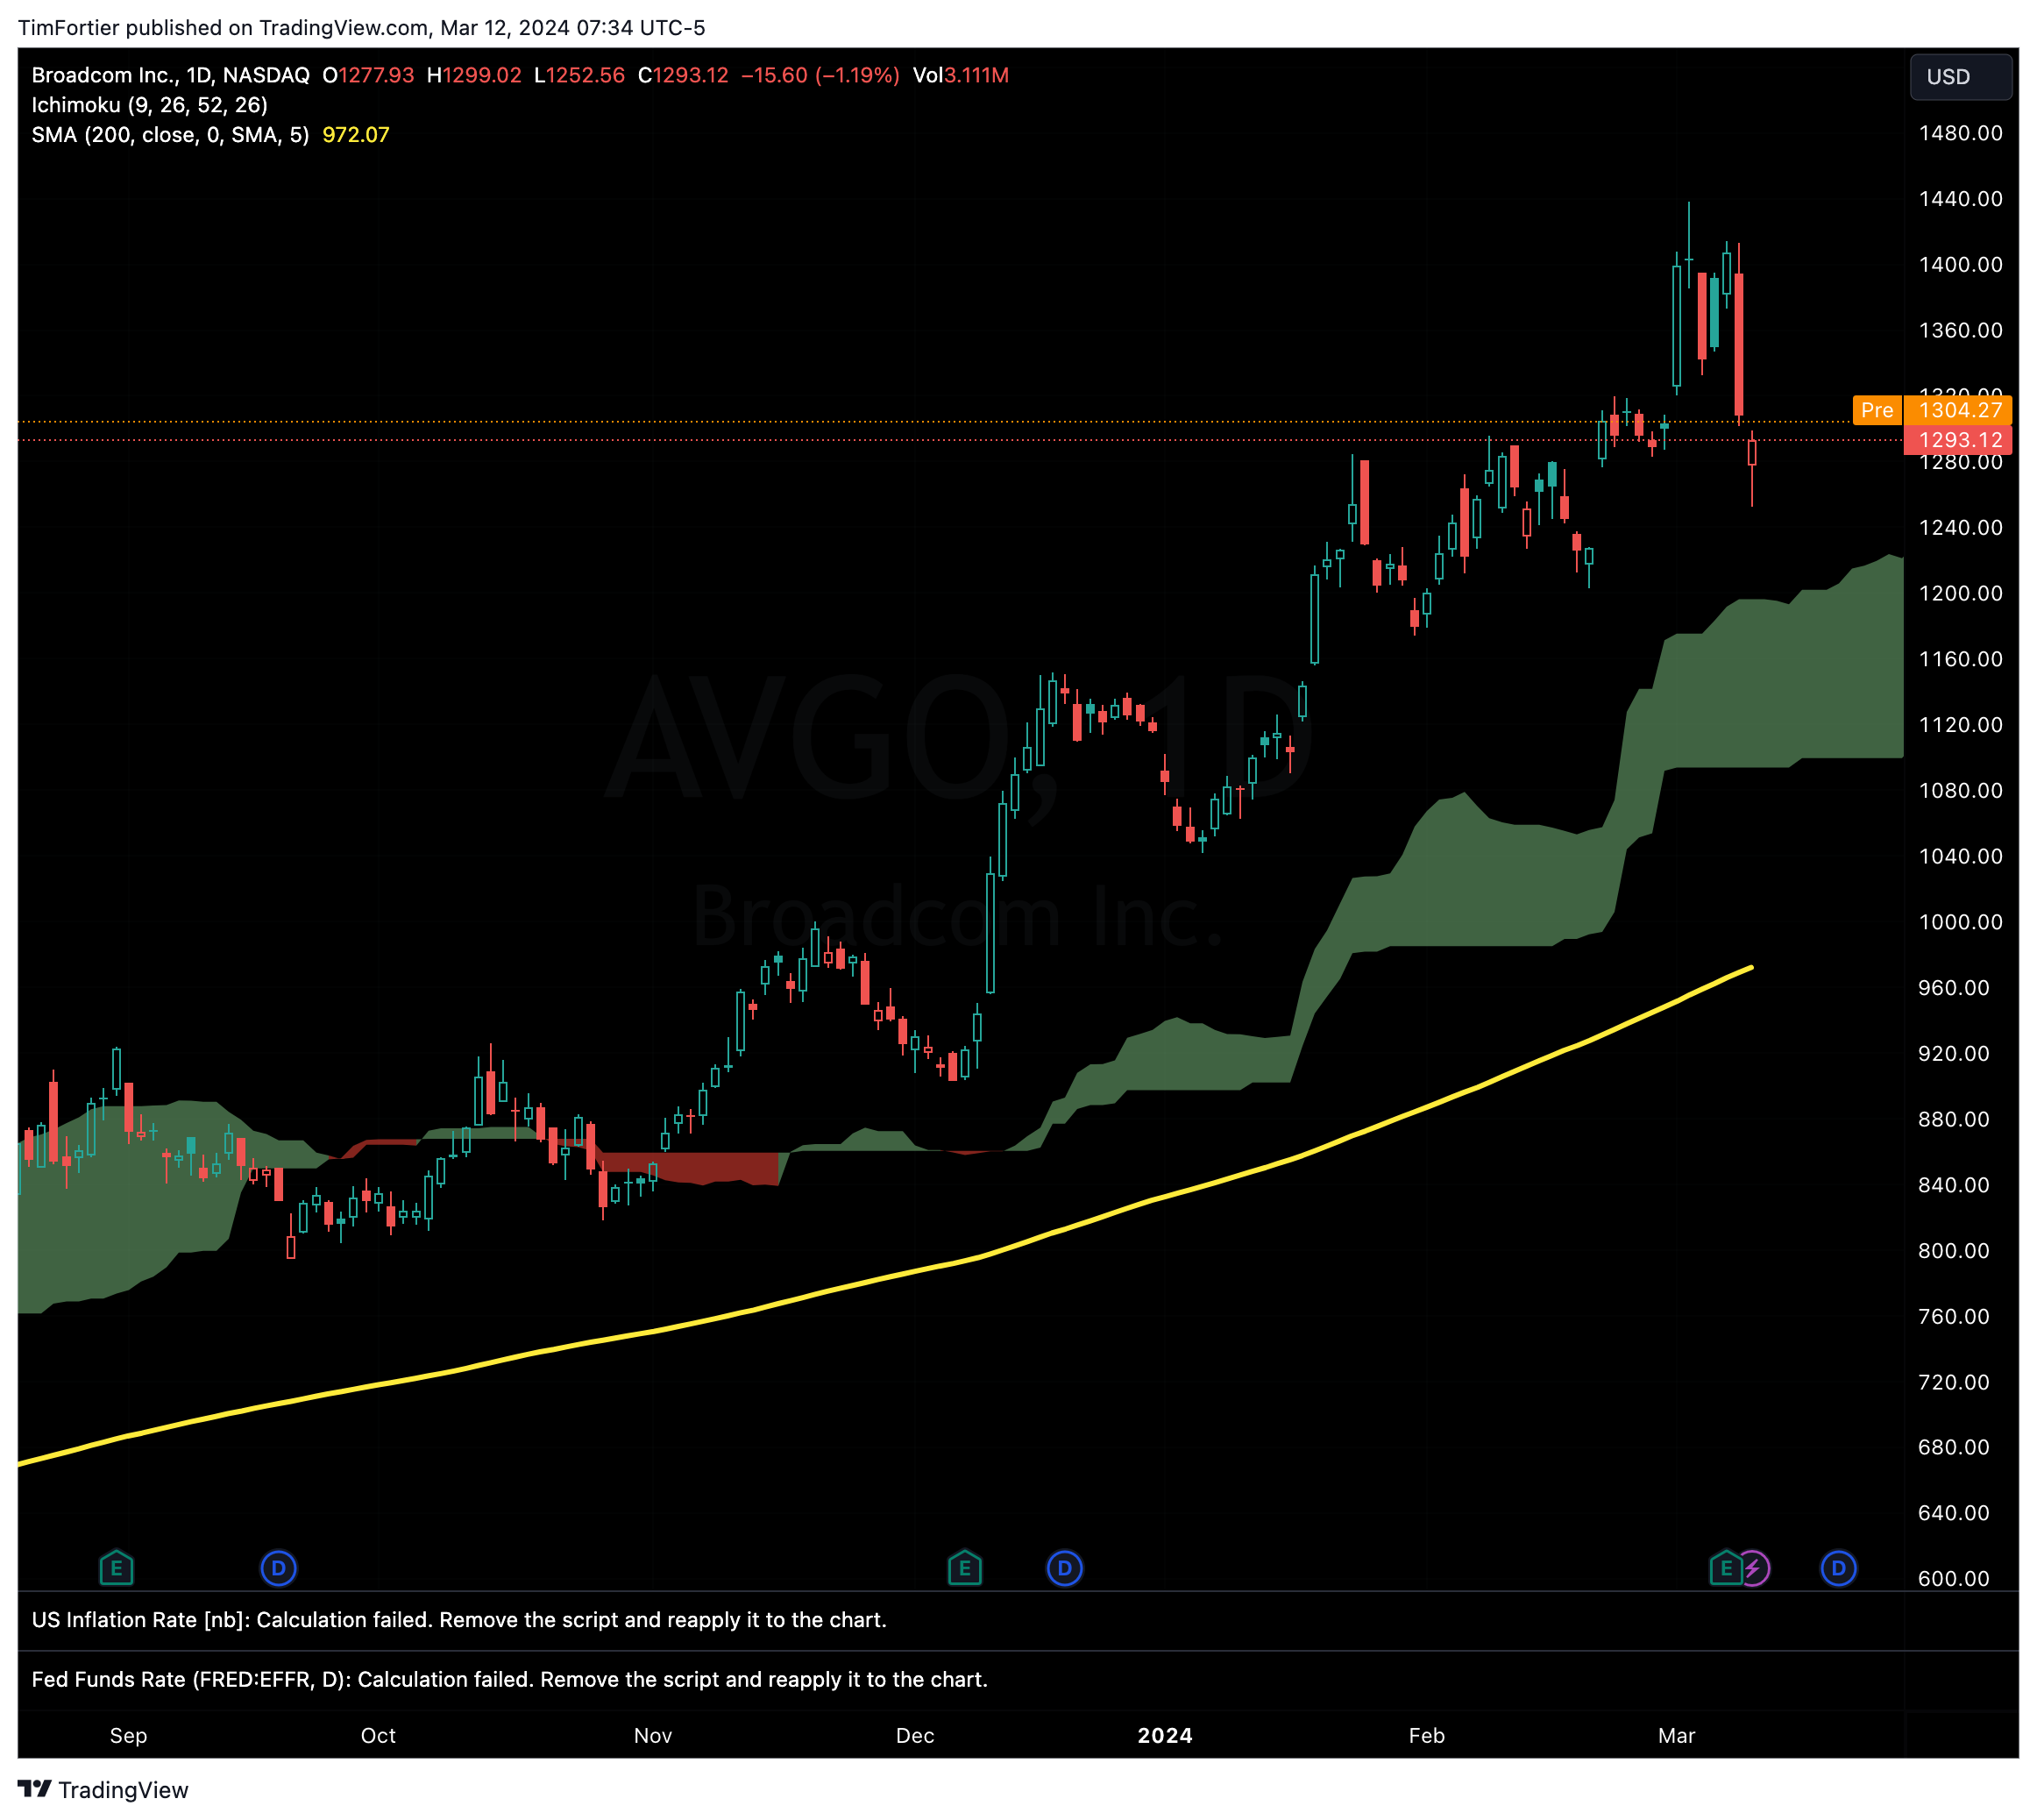
The recent market action in these leading stocks, coupled with the extremely bullish sentiment surrounding this group suggests that investors should be cautious, protecting the profits they do have and exercising added caution adding to any new investments.
CPI Update
The consumer price index, a broad measure of goods and services costs, increased 0.4% for the month and 3.2% from a year ago. The monthly measure was in line with expectations while the 12-month reading was slightly higher.
A 2.3% increase in energy costs along with a 0.4% increase in shelter (yet again) contributed to the slightly higher-than-expected reading.
Reaction in the bond market is as one would expect with yields rising.
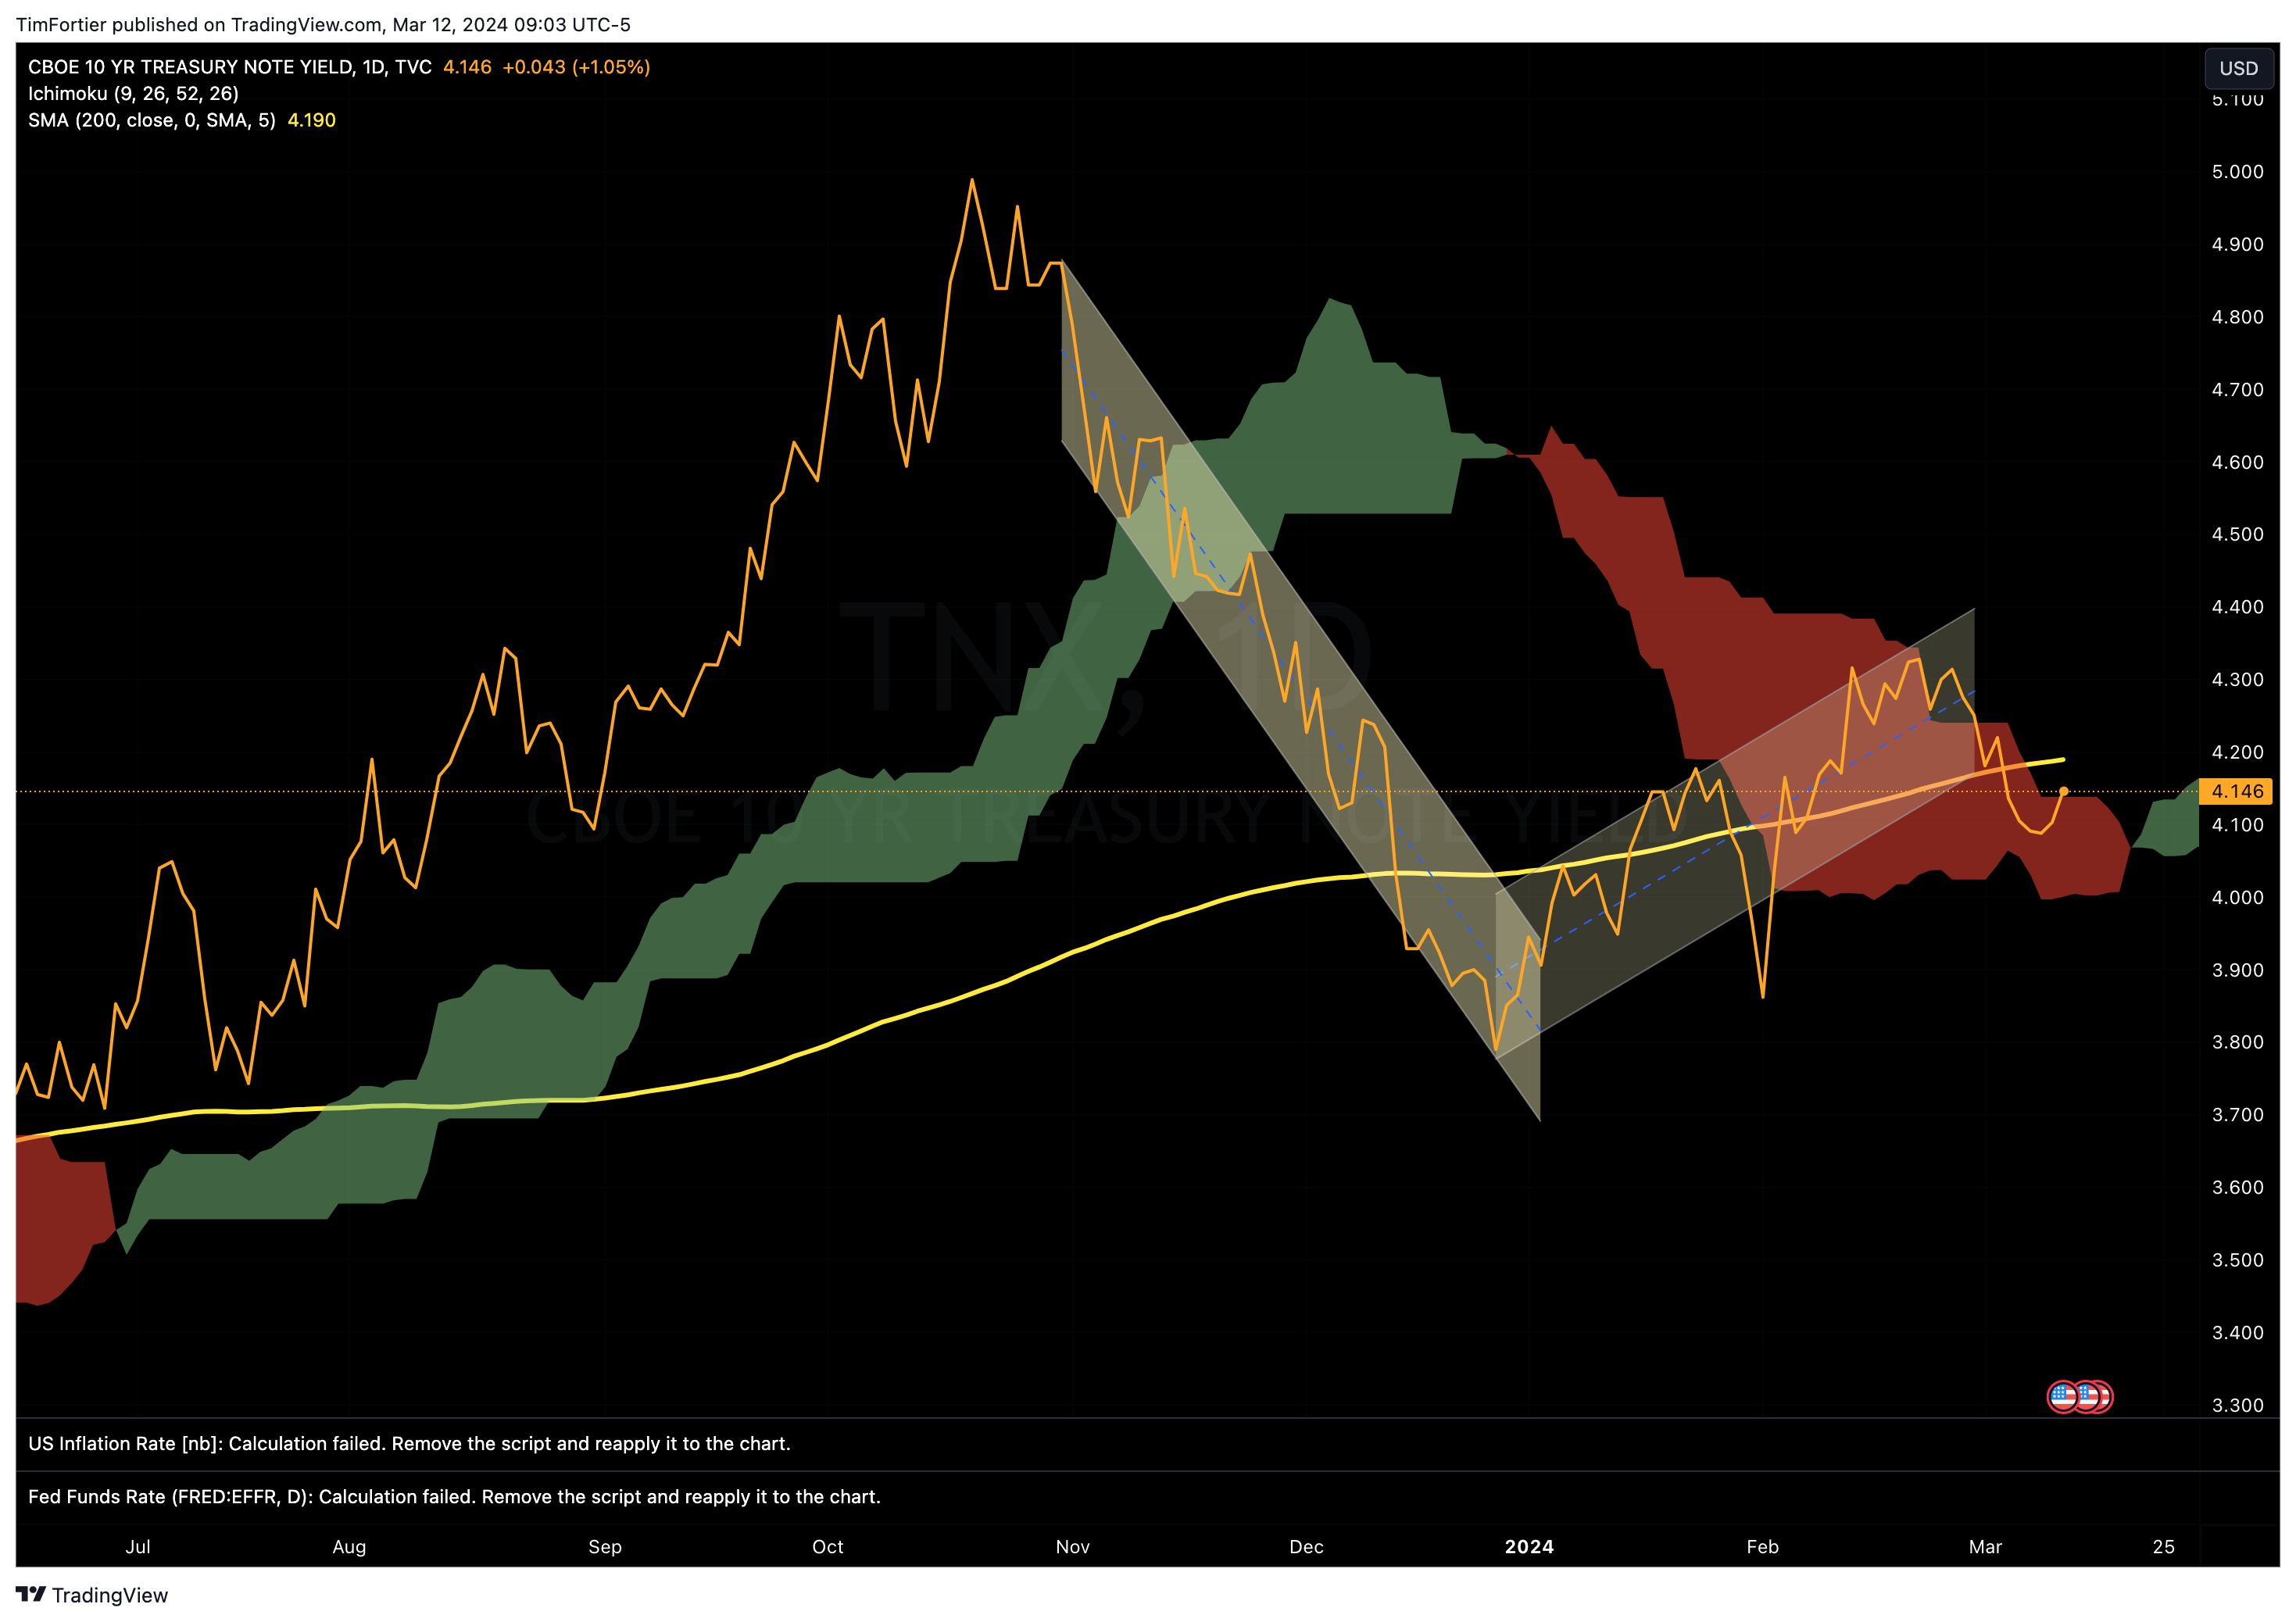
Interest rates have been range bound over the past several months, reacting to every piece of news and comment from the Fed.
Looking at a Point and Figure chart of the yield on the Ten Year Note does a good job of filtering out all of the “noise.” One can clearly see that the trend in rates remains higher.

Only a move below 3.30% would negate the rising trend pattern.
Interest rates remain a key variable for growth stocks whose valuations are at extremes and could be vulnerable to further increases in rates.
If you’ve been considering hiring an advisor to help guide you through the ever-changing financial landscape, take your first step today by scheduling a free consultation with one of our experienced team members. There’s no risk in exploring if we’re the right fit for your financial goals. Contact us now.
If you have any questions or have been considering hiring an advisor, then schedule a free consultation with one of our advisors today. There’s no risk or obligation—let's just talk.
Tags

Free Guide: How to Find the Best Advisor for You
Get our absolutely free guide that covers different types of advisory services you'll encounter, differences between RIAs and broker-dealers, questions you’ll want to ask when interviewing advisors, and data any good financial advisor should know about you and your portfolio.
