
Related Blogs
November 4, 2020 | Michael Reilly
 History says that U.S. stock markets are set to break out of the starting gate for what is typically the best six months of the year.
Just as summer changes to autumn and autumn turns to winter, the stock market moves through seasonal changes as well.
According to our sources, most of the market’s annual gains tend to be produced in the months November to April – the strongest six months, while stocks tend to go sideways and are more prone to downdrafts – as we have experienced this year – during what are considered the “worst six months”, May to October” – hence the old Wall Street adage “sell in May and go away”.
There is no denying that market seasonality has not followed tradition this year. It’s 2020 after all, so if we’ve learned anything, it’s that nothing should surprise us!
Here’s a chart of the S&P 500 index looking back as far as 1950.
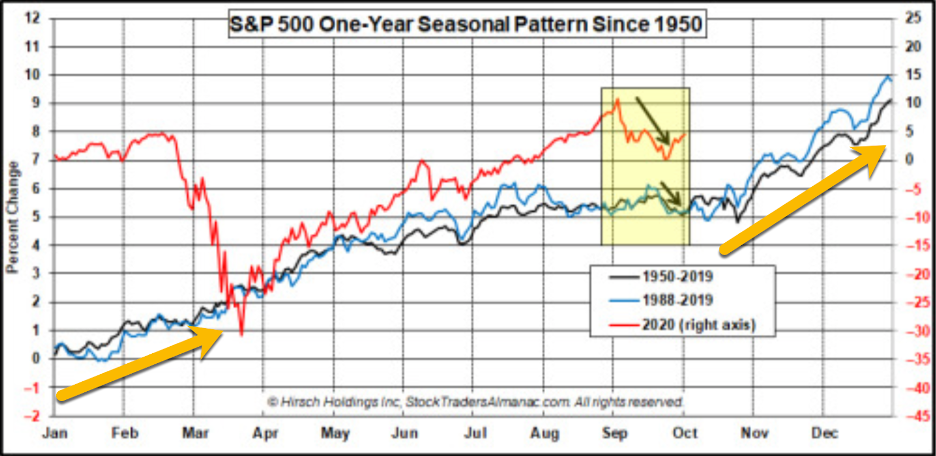
Pay special attention to the yellow arrows that follow the S&P’s moves (black and blue lines) between November and April. The S&P has a long history of moving from bottom left to upper right – we call this and uptrend. I included 1988 forward as an additional study, because that is when circuit breaker rules were added to address fast moving markets. But as you can see, regardless of time frame, markets have formed a strong seasonal bias towards growth.
It doesn’t always work – as we’ve witnessed in previous years when market seasonality patterns haven’t worked – when these patterns were overridden by more powerful forces. And the 2020 COVID-19 pandemic and economic shutdown certainly qualifies – red line.
But here’s the thing – human nature just doesn’t change much – it’s only a matter of time until repetitive human behavioral patterns return to moving money around in the usual daily, weekly, monthly, quarterly and seasonal patterns.
When you get right down to it, investors are driven by two very basic and strong emotions – FEAR and GREED. And until those two basic characteristics of human nature change, market patterns, including seasonality will persist.
And if November marks the beginning of another seasonality pattern. Well then, now’s the time for investors to consider loading up on market leaders.
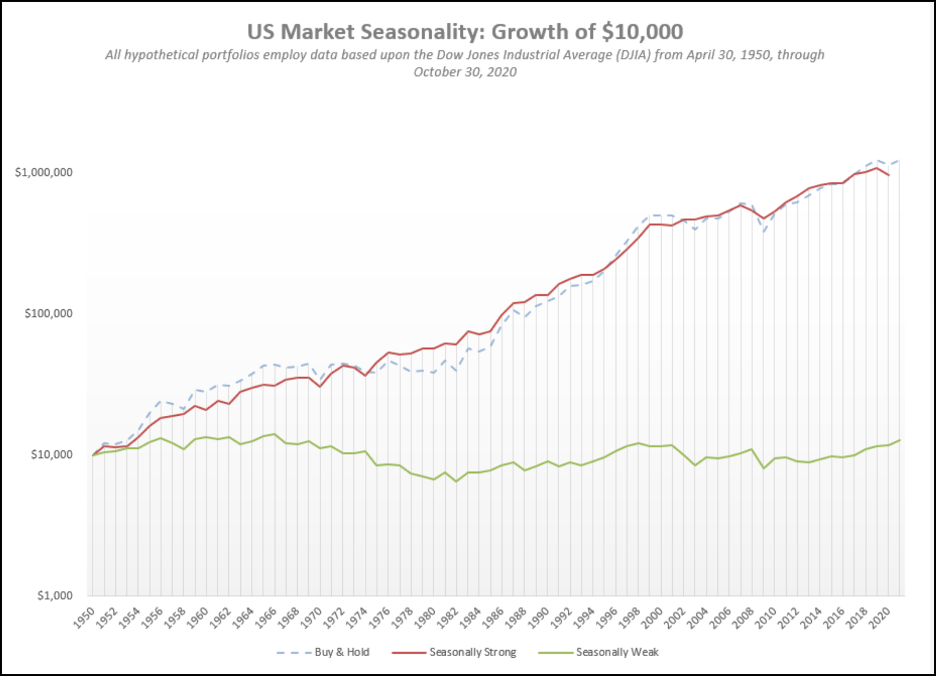
Consider this: had you invested $10,000 in the Dow Jones on April 30 and sold it on October 31 each year since 1950, your cumulative return would be only about $12,750 – which is nothing short of pathetic.
But, if instead, you had invested the same $10,000, only during the seasonally strong six months of the year (Nov-April) your investment would now be worth just under $1 million!
Said another way, almost all the growth of the Dow since 1950 has effectively occurred during the “strong” six months of the year.
Listen, this isn’t the most sophisticated analysis we’ve reviewed, however, it clearly shows a seasonal bias that investors should know about.
Here are a few facts:
- Since April 30, 2000, the Dow Jones Industrial Average has gained over 146%. However, the Dow is up just over 27% when we isolate the seasonally weak periods since 1950.
- During the seasonally ‘weak’ May to November periods, 27 out of the 70 years examined finished down, while the seasonally strong periods produced a negative return almost half as often – down only 15 out of 70 years.
- There have been only three years when the “strong six months” have lost more than 10% (1969, 1973, and 2008), while the “weak six months” have seen losses of 10% or more 11 times.
- There have been 15 instances since 1980 where the “strong six months” have posted a double-digit return, with five of those returning more than 20%.
So, is this a sure-fire recipe to investment success? – of course not. But the data does provide savvy investors an opportunity to take advantage of seasonal trends by looking for stocks best positioned to see higher prices during the seasonally strong six months of November and April.
Other factors working in our favor: U.S. equities sit atop the Asset Class rankings moving into the 4th quarter of 2020. The 59th Presidential election should be officially decided over the coming days. And with the election results, it’s possible that additional policies to stimulate economic growth again are on the table – and I wouldn’t bet against 70 years of seasonal bias.
Until next time, invest wisely.
Tags

Get Our FREE Guide
How to Find the Best Advisor for You
Learn how to choose an advisor that has your best interests in mind. You'll also be subscribed to ADAPT, Avalon’s free newsletter with updates on our strongest performing investment models and market insights from a responsible money management perspective.
