
Related Blogs
February 25, 2022 | Avalon Team
 “There are decades when nothing happens and there are weeks when decades happen.”
–Vladimir Lenin
As the world now knows, Russian president Vladimir Putin announced the start of a “military operation” in Ukraine, attacking several cities in the Eastern European country after months of amassing troops at its borders.
This act of aggression will likely reinforce global macro trends already in place – namely that of rising inflation and soaring commodity prices.
Even before tensions between the Ukraine and Russia escalated, the Dow Jones, S&P 500, and Nasdaq saw major declines across the board.
By February 23, the day before Russia’s military started its operations on Ukrainian territory, the Nasdaq had declined 16.7% this year, while the S&P 500 and Dow Jones Industrial Average had lost 11.3% and 8.9% compared to the end of 2021, respectively.
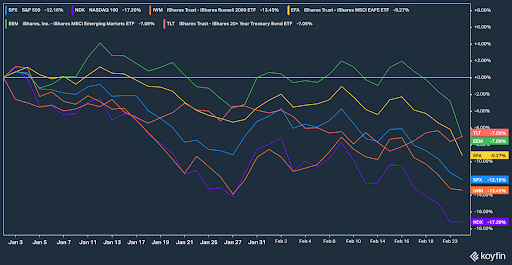
The impact of soaring inflation and rising interest rates was already having an impact on the markets.
iShares 20+ year Treasury Bond (TLT) is also negative, as I warned previously that bonds would not provide the safe haven as they have in the past. Here’s your evidence.
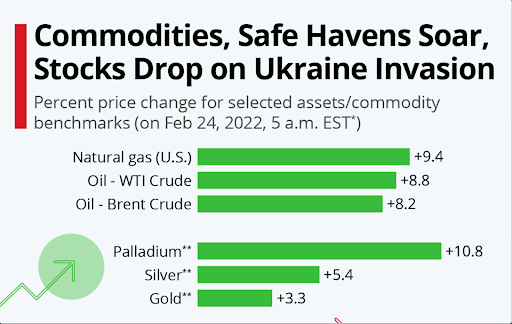
With Russia and Ukraine being some of the largest exporters of commodities like oil, gas, wheat, copper, and nickel, the ongoing conflict will most likely result in price hikes as well as a further exacerbation of supply chain disruptions.
The reaction to the Ukrainian invasion is as expected. Impacted commodities (EU natural gas, oil, palladium, wheat) initially ripped higher.
Year-to-date, there’s been a significant performance differential between U.S. stocks and commodities.
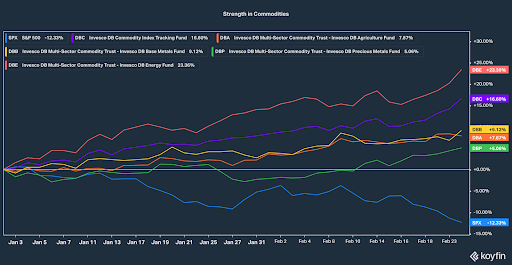
This trend is likely to persist.
Sanctions against Russia are designed to severely restrict Russia from selling oil and other essential commodities in the international markets. Without an emergency supply response by OPEC, oil could surge beyond $150 per barrel.
Other commodities are vulnerable too. Russia is now by far the largest supplier of natural gas to Europe. It is also the world’s largest supplier of palladium and the second-largest producer of cobalt (EVs).
A surging oil price has caused almost every recession in the US since 1945. Global growth could be reduced by 75% this year if oil jumps to $135 per barrel.
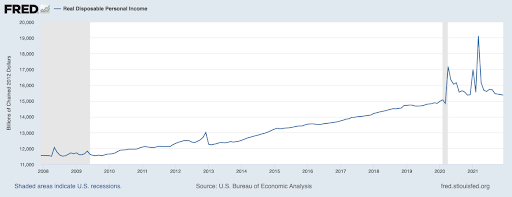
It is almost certain that the result of all of this will be stagflation. Personal disposable income has recently weakened and it is almost certain that higher energy costs will continue to put pressure on the consumer.
Strategy
One of the most important points to understand is how economic regimes dictate asset mix. My fear is that too many investors will be slow to recognize this important distinction.
Investors have not had to deal with rising interest rates, soaring inflation, and commodity supply restrictions since the 1970s.
As a result, investors remain overweight in traditional stocks and bonds and underweight in hard assets.
The problem with accommodative Fed policy is the markets are NOT prepared for exogenous events such as this. There are still trillions of US Dollars in financial assets that must move into hard assets.
This will provide opportunities in precious metals mining stocks and reinforce trends already in place in key commodities.
The Stock Market
This daily chart of the S&P 500 shows key support areas.
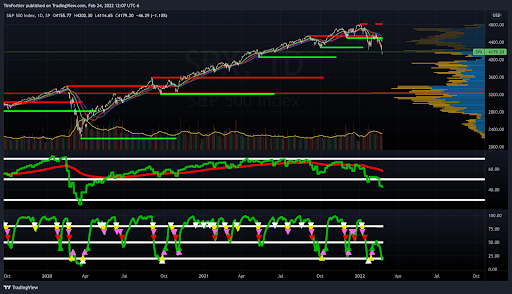
On the right side of the chart is the volume profile. This indicator reveals significant price levels as determined by the volume traded at each level. The most significant bar is around the 3200 level. This is key long-term support for the market.
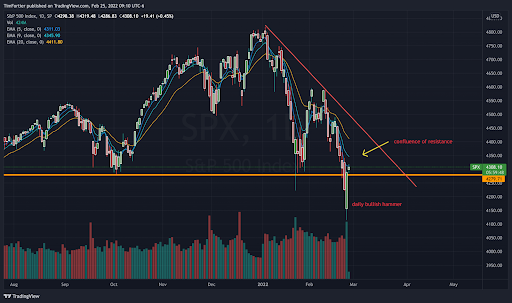
Looking more close up, the price action on Thursday broke the last significant price level of what some technicians might call the neckline of a head-and-shoulder top.
This has initially been met with “buy the dip” as U.S. stocks finished higher on Thursday and formed a bullish daily hammer. Traders felt that the war would lessen the likelihood of the Fed raising interest rates.
I do believe though, that this rally will be short-lived. The panic-low had caused prices to stretch away from trends and what we are seeing is a more likely reversion to the mean price action.
There should be a confluence of resistance with the 5, 9, and 20 exponential moving averages defining the trend until proven otherwise. I’ll place the current resistance on the S&P 500 around 4260.
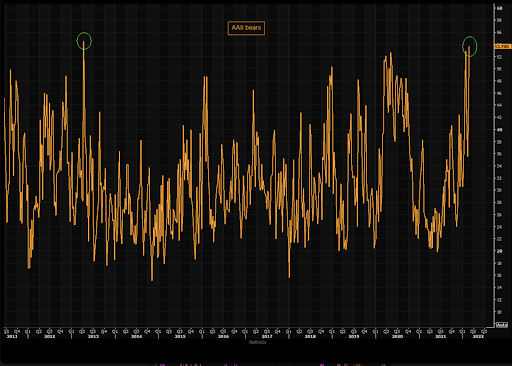
Bearish sentiment has also reached an extreme. This can often be a short-term contrary indicator. If prices can consolidate around current levels, it should help work off some of the bearish sentiment.
I believe that Sectors that are highly dependent on consumer spendings, such as retailers and home builders (all part of the broader Consumer Discretionary) should be avoided.
Even if issues between Ukraine and Russia can be resolved soon, the factors that have brought us inflation will remain.
If you have any questions or have been considering hiring an advisor, then schedule a free consultation with one of our advisors today. There’s no risk or obligation—let's just talk.
Tags

Free Guide: How to Find the Best Advisor for You
Get our absolutely free guide that covers different types of advisory services you'll encounter, differences between RIAs and broker-dealers, questions you’ll want to ask when interviewing advisors, and data any good financial advisor should know about you and your portfolio.
