
Related Blogs
April 27, 2023 | Chris Rowe
As most readers know, I am not a fan of popular indexes like the S&P 500.
The performance of these cap-weighted indexes doesn’t often tell the story of the “true” market, masking important trends going on.
Like right now.
One of the main bullet points for bears in 2023 has been a lack of participation.
A small group of mega-cap stocks is behind almost all of the S&P 500’s 2023 rally.
Unless you have been living under a rock, you know that AI is the hot topic du jour.
How big is it?
HUGE.
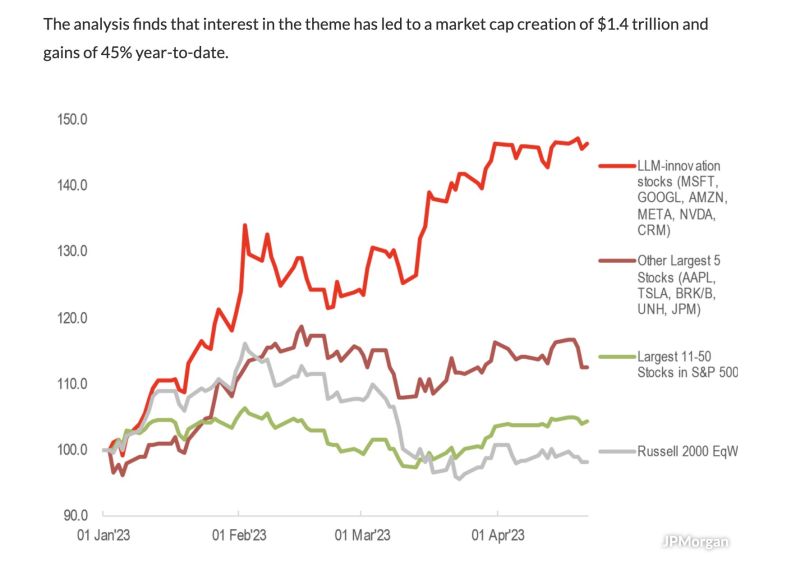
According to J.P. Morgan, OpenAI’s ChatGPT AI Revolution has driven a gigantic $1.4 trillion surge in stock market gains so far this year.
That’s more than 50% of the YTD gains.
In the analysis from J.P. Morgan, they explain that interest in AI sparked by ChatGPT has generated 53% of the S&P 500 SPX performance, 54% of the Nasdaq 100 QQQ performance, and 68% of growth factor gains.
The basket groups together Microsoft, Google, Amazon, Meta, NVIDIA, and Salesforce in what it calls “LLM-innovation” stocks.
Overall, Silicon Valley titans Alphabet, Apple, Meta, and Nvidia, Seattle’s Amazon and Microsoft, and electric vehicle giant Tesla gained more than $2.1 trillion in market capitalization year-to-date, according to FactSet data.
Incredibly, those seven stocks account for 88% of the S&P’s 2023 gains, with the index up $2.4 trillion this year.
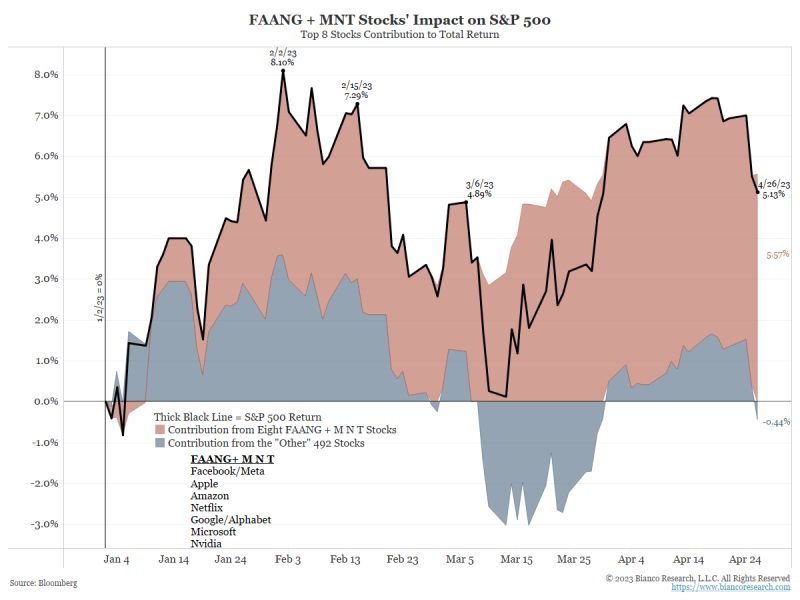
Through yesterday (April 26), the year-to-date return S&P 500 (black line) was 5.13%.
The top eight FAANG+ MNT contributed 5.57% to the overall 5.13% of the S&P 500.
The “other 492” contributed a -0.44% return to the S&P 500…
So the “other 492” has collectively dragged the S&P 500 lower…
Which is why we always look at the “true market” through the lens of Relative Strength and sectors.
When viewing through the lens of sector performance, it’s easy to see how uneven the performance has been so far this year.
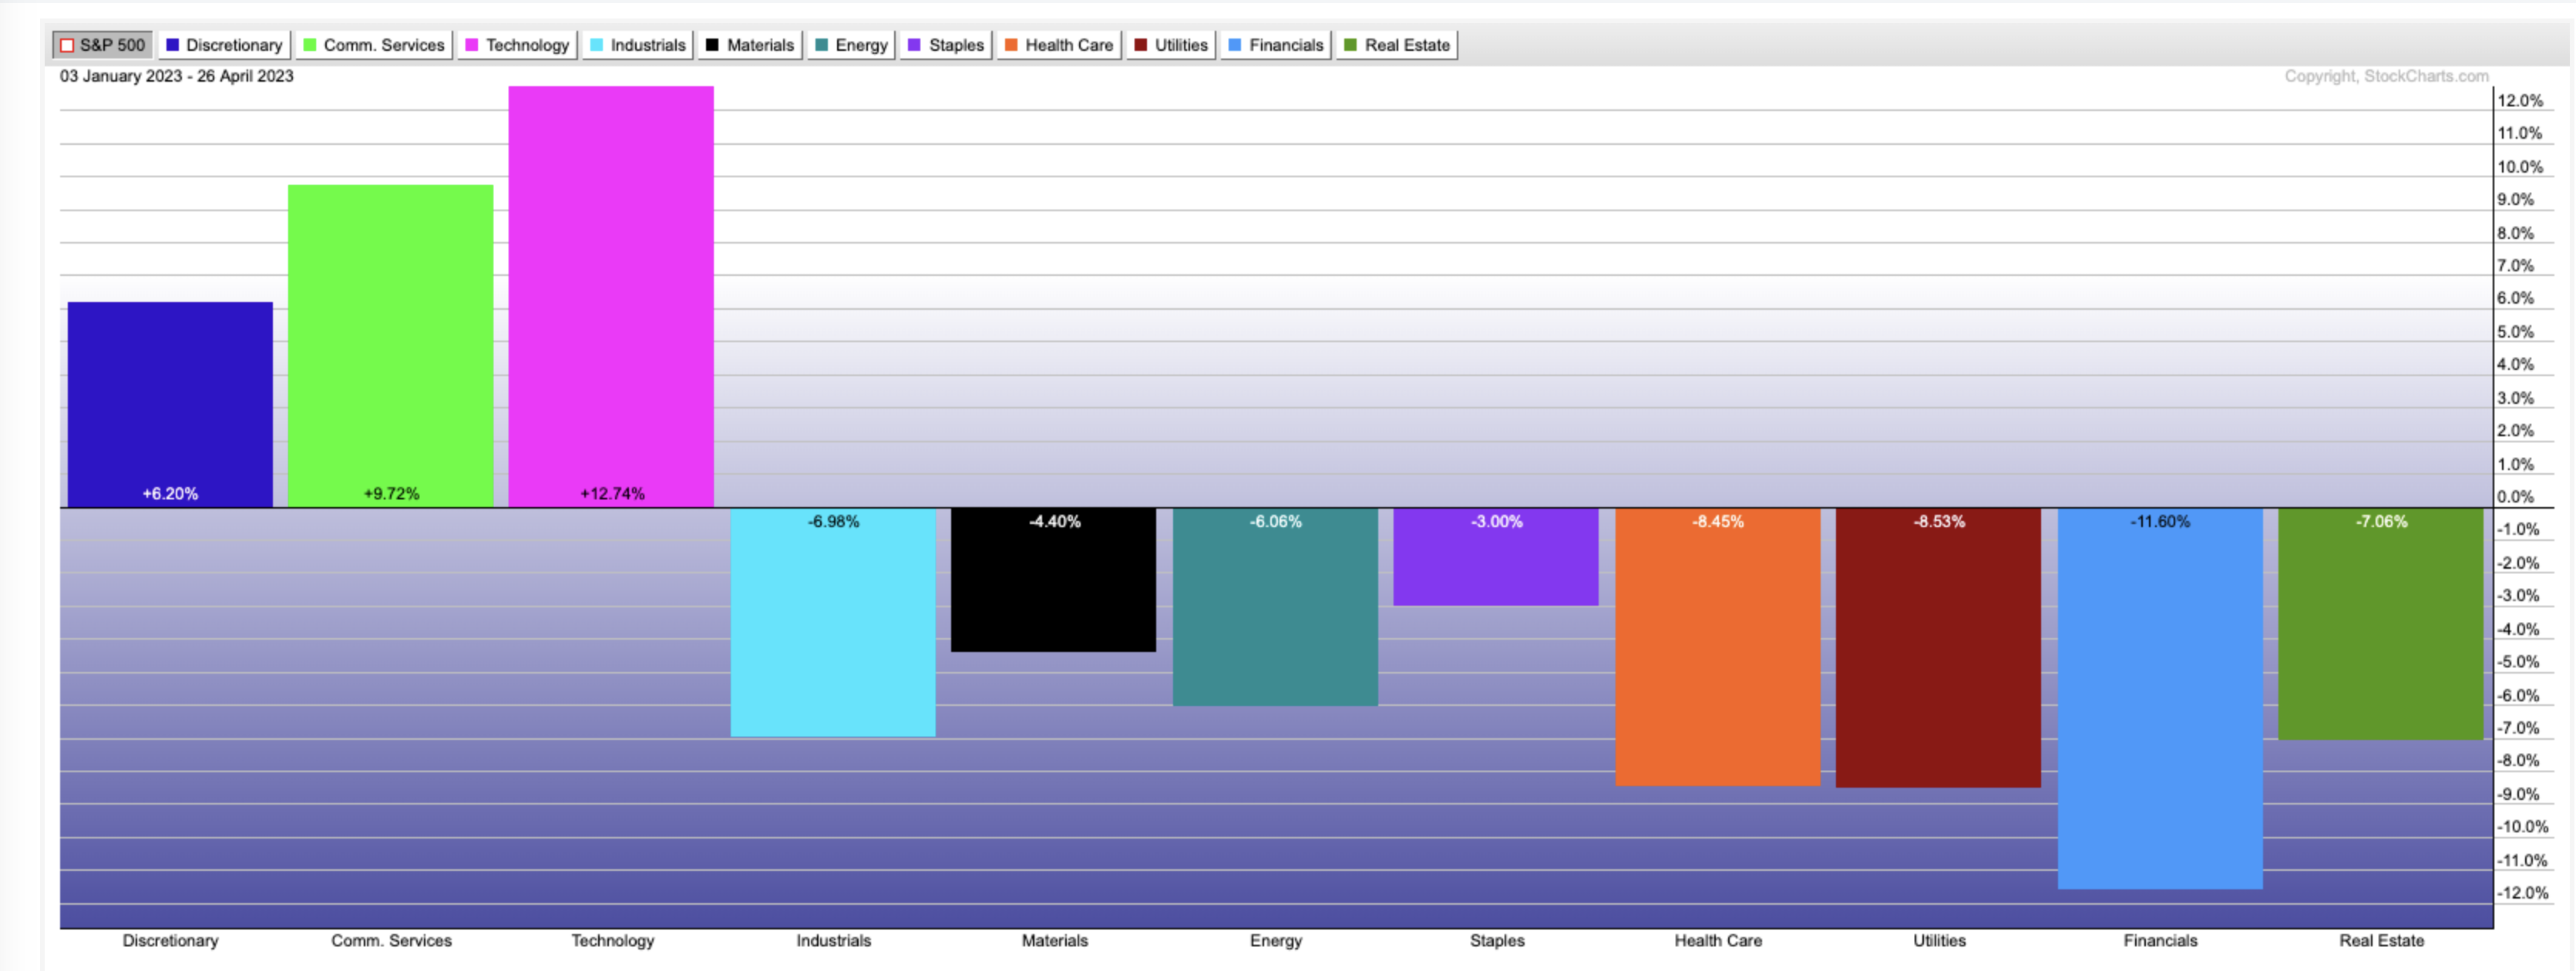
There is over 24% difference of separation between the leading Technology sector and the worst-performing Financial sector.
Now let’s dig even deeper…
On the basis of absolute momentum (aka Relative Strength), International continues to be the top-ranked asset class, which is not too surprising given how weak the U.S. market is overall once we strip out the handful of market leaders.
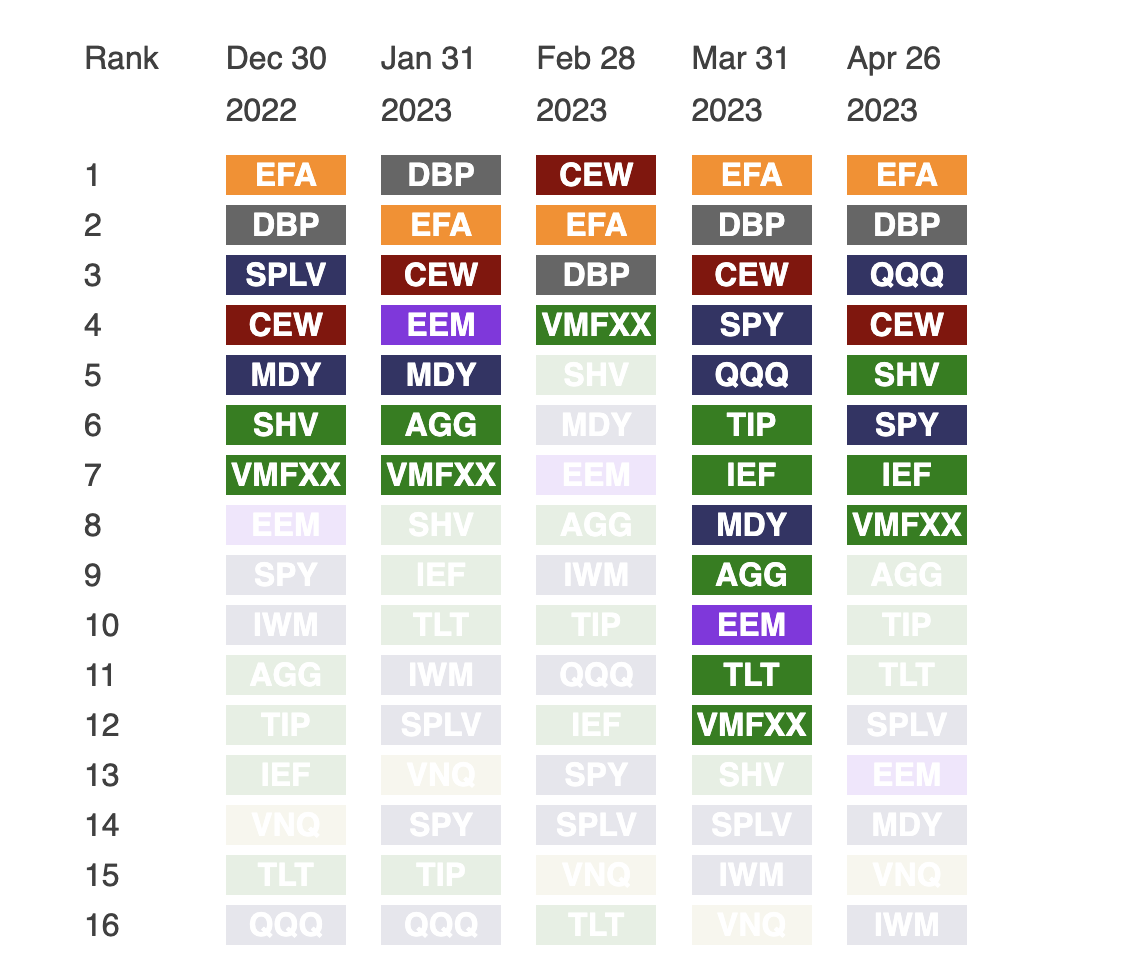
The strength of International stocks has been a consistent theme this year so far.
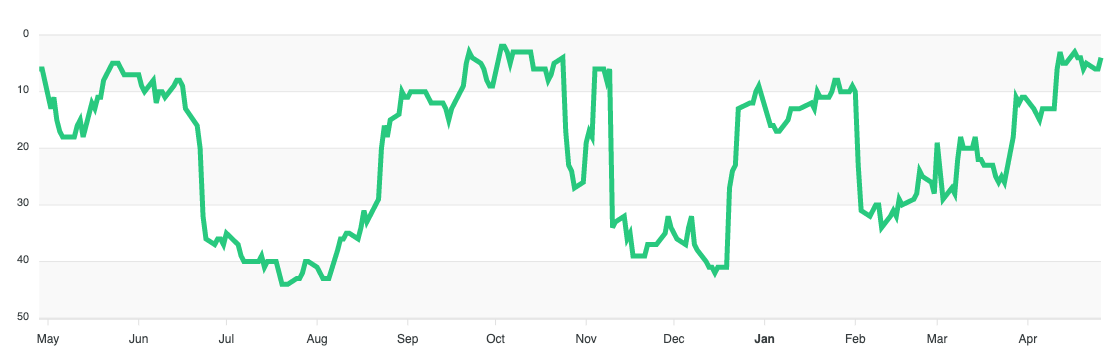
One example is Latin America which currently ranks 4th in our Sector Relative Strength Matrix.
The green line below displays the Relative Strength ranking within our matrix of 45 sectors/groups over the past 12 months.
International – Latin America
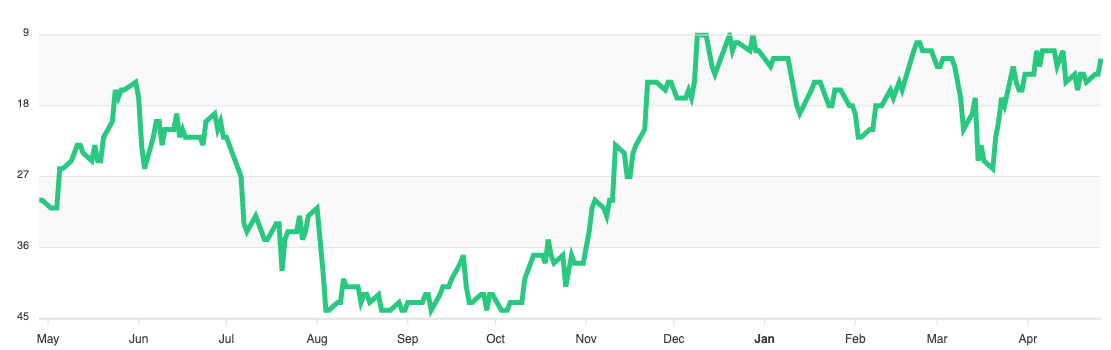
And Europe, currently ranked 12th, is also displaying persistent Relative Strength in recent months.
International – Europe
Currently, Asia is ranked lower but appears to be strengthening.
International – Asia Pacific

The message here is that it is essential for investors to understand how market internals can paint a different picture than what they display on popular financial channels.
It’s important to have a way to process that can help you identify what is truly strong while avoiding what is weak.
Which is exactly how we invest here at Avalon.
As an example, our Volatility Resistant Model has owned both international and technology stocks this year… the two best asset classes any investor could own.
If you have any questions or have been considering hiring an advisor, then schedule a free consultation with one of our advisors today. There’s no risk or obligation—let's just talk.

Free Guide: How to Find the Best Advisor for You
Get our absolutely free guide that covers different types of advisory services you'll encounter, differences between RIAs and broker-dealers, questions you’ll want to ask when interviewing advisors, and data any good financial advisor should know about you and your portfolio.
