
Related Blogs
March 7, 2019 | Michael Reilly
This past Wednesday was pretty much like any other Wednesday – right?
Well, sort of… Wednesday – March 6, 2019, had the dubious honor of marking a milestone anniversary…
And not one most investors care to celebrate!
Just the mention of it is enough to send some investors – the ones who experienced it, into a cold sweat.
Hard to believe, but Wednesday was 10 years ago to the day that the S&P 500 Index (SPX) hit rock bottom, marking the end of the worst financial crisis the United States has experienced since the Great Depression.
On March 6, 2009, the S&P 500 hit 666.79. The lowest it has traded in the past ten years.
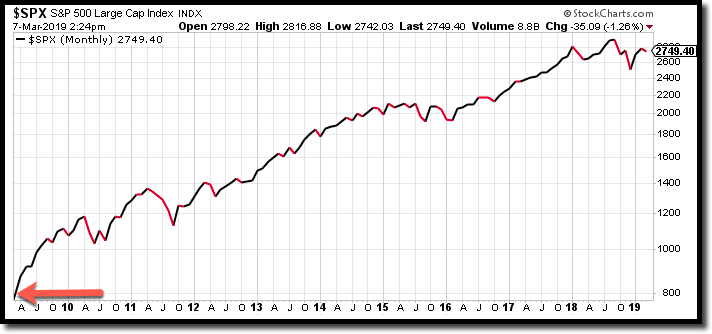
Since then, there have been big dips, scary headlines, and plenty of volatility, like what we saw in 2011, 2015, and most recently in December 2018.
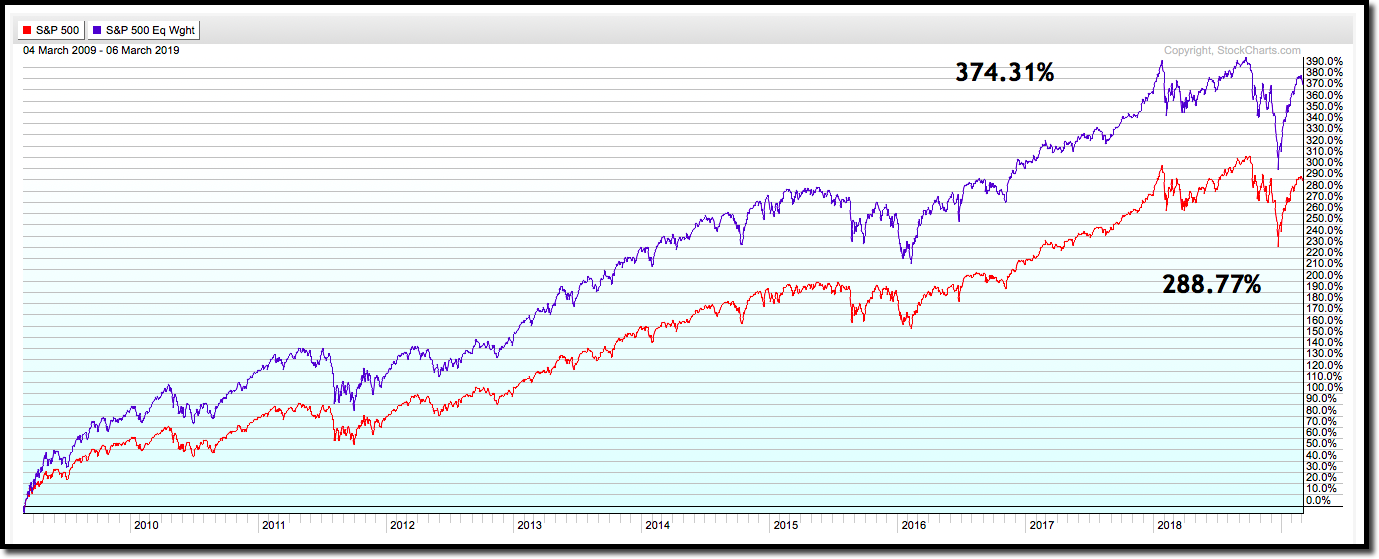
In spite of volatile markets over the years, the cap weighted S&P 500 index has risen more than 288% over the last decade.
Most people might be satisfied with returns like that.
But…investors could have crushed those returns by applying a very simple relative strength tool, that would have pointed you to invest in the other S&P 500 index.
That’s right, if you had invested your capital in the other S&P 500 index you could have racked up not just 288% returns, but over 374% in gains!
You see, while most investors may not even realize the S&P 500 has a doppelgänger, savvy investors were applying a little relative strength magic – creating an edge and turning solid gains into potential lifestyle-altering returns.
And this is what applying relative strength strategies – like this simple example below can do…
Let me explain…
There’s the S&P 500 index that most people are familiar with – the cap weighted index (SPX) – this is the one that puts more emphasis or weighting on the biggest companies trading in the S&P and less emphasis on smaller companies. So the biggest companies have a greater influence on the returns of the index.
Then there’s the “other” S&P 500 index – this one is equally weighted (SPXEW) – not giving too much value to any one company over the rest.
Over time, based on where the big money flows, the two S&P’s will flip-flop, with one version gaining the upper hand on the other.
And that relative strength of one S&P 500 over the other can result in greater returns for investors – like the difference between 288% or 374% gains over the previous decade.
But it only works if you know how to spot it.
What you’re looking at below is a simple relative strength comparison between the two version of the S&P 500 – the cap weighted index vs its equally weighted doppelgänger.
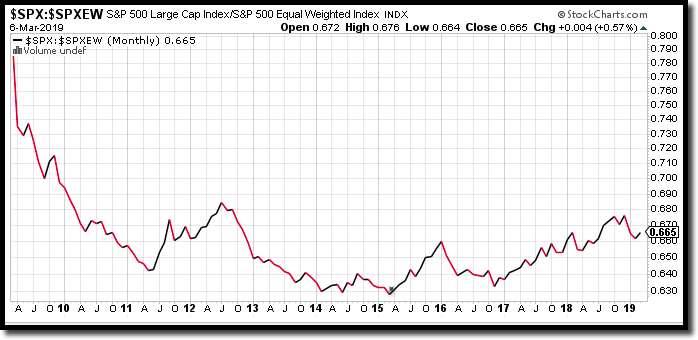
This line chart compares the relative strength between the two alternative S&P 500’s. So, it helps identify which S&P 500 index is stronger and may offer greater profits.
It’s a pretty simple comparison to follow.
When the line chart is moving in an upward direction, the S&P 500 (cap weighted) is stronger on a relative basis compared to its equally weighted counterpart.
When the line chart is dropping, the opposite is true, the cap weighted S&P 500 Index (SPX) is not performing as well as the equally weighted version of the S&P 500, on a relative basis.
Said another way, when the line chart is moving down, the equally weighted index (SPXEW) is stronger on a relative strength basis then the cap weighted index.
For a clear picture, I’ve added a few notations to our line chart.
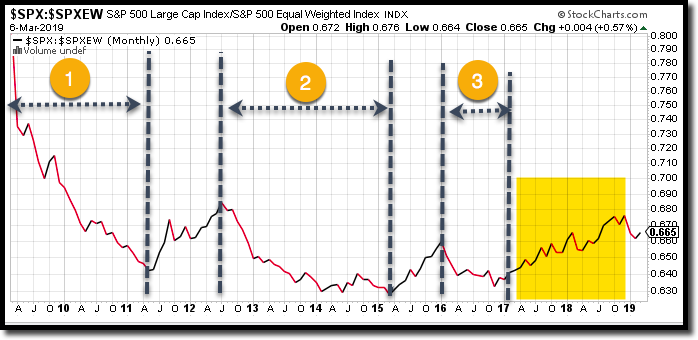
The time frames identified by #1, #2, and #3 are years when the equally weighted index outperformed the cap weighted index – the “traditional” S&P that most investors use.
To the far right of the relative strength chart, I’ve highlighted an area where the cap weighted index was stronger than the equally weighted version – seen here dating from January 2017 to late 2018.
Thus far in 2019, the equally weighted index has been outperforming the cap weighted S&P 500 index.
What you’ve just read is no fluke. It’s the reason relative strength analysis remains the foundation of our investment process.
And it’s worth the effort. Take a look at these statistics provided by Nasdaq Dorsey Wright.
The average annual dispersion (12/31/1998- 12/29/2017) between the best and worst performing asset class has been 31.23%.
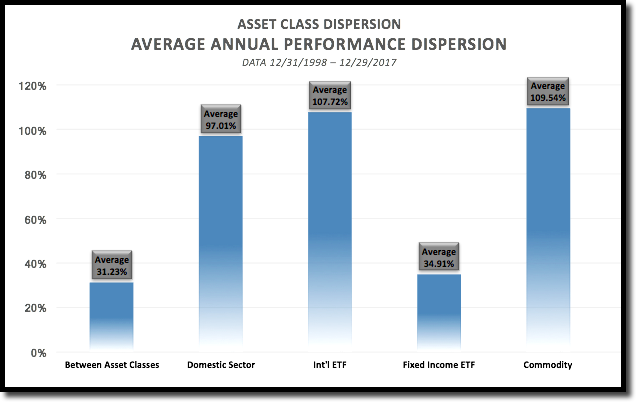
Chart courtesy Nasdaq Dorsey Wright
More impressive is the potential impact of choosing only the strongest sectors when committing capital.
The dispersion is off the charts when comparing returns between the best performing and worst performing U.S. sectors – with an average annual dispersion of 97.01%.
This might give you a little insight into why we design some of our investment models to target the top performing sectors based on relative strength, and as to why some of the top investors today refuse to even consider stocks that don’t have high relative strength scores.
If you’re interested at a deeper look into some of these models, don’t hesitate to schedule a consultation with one of our advisors.
Investors with assets valued at $500,000 or above are eligible for a free consultation, which will allow you to see in detail how allocating assets to the highest rated sectors can substantially improve your chances of outperformance.
Don’t wait too long, schedule a consultation today.
And, as always, invest wisely.

Get Our FREE Guide
How to Find the Best Advisor for You
Learn how to choose an advisor that has your best interests in mind. You'll also be subscribed to ADAPT, Avalon’s free newsletter with updates on our strongest performing investment models and market insights from a responsible money management perspective.
