
Related Blogs
April 12, 2018 | Michael Reilly
 Our relative strength process focuses on following the trend, wherever it may be.
Relative strength trends can exist between Asset Classes — Domestic Equities compared to Fixed Income, for example — or at the sector level, Technology over Utilities.
But there is another way to view relative strength. And that is through both Size and Style.
When we discuss Size and Style, what we are referring to is the relative strength of Large-Cap stocks over Small-Cap or Mid-Cap stocks (Size), and the relative strength of Growth stocks vs. Value stocks (Style).
Recently, our algorithms alerted us to a change in Size and Style.
Small-Cap Growth stocks have replaced Mid-Cap Blend stocks as the #2 position behind Large-Cap Growth Stocks.
What’s important to note here is that this continued improvement in Growth stocks has come largely at the expense of Value alternatives.
While Large and Small-Cap Growth are the strongest members of the Size and Style category, Large-Cap Value stocks (to the extreme right) are the weakest of the weak.
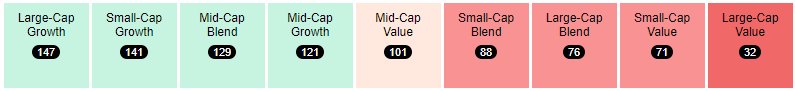
The improvement in Large and Small-Cap Growth serves as further evidence that we remain in a Growth-dominant market today.
Just as most of us tend to do some “spring-cleaning” around the house this time of year and get rid of things that we no longer need – or perhaps finally get rid of those things hanging in our closet that went out of fashion years ago, investors may want to do some “spring-cleaning” of their portfolio.
Those investors looking to spruce things up a bit could look to clean out some of those value positions that went out of style like the clothes in a closet.
In doing so, make room for the relative strength found in the Size and Style advantage of Growth over Value, and Large-Cap and Small-Cap over Mid-Cap.
The bar chart below helps to illustrate this point. To the left side of the chart are Large, Small and Mid-Cap Growth ETFs, while the right side of the bar chart includes Large, Small and Mid-Cap Value ETFs.
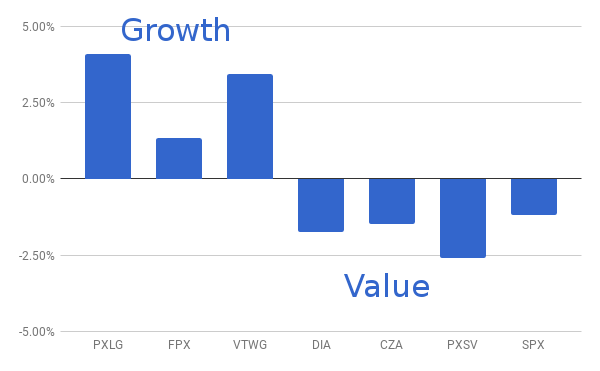
Growth ETFs
The Large-Cap Powershares Russell 2000 Top 200 Pure Growth ETF (PXLG) is up 4.1% year to date, the First Trust Mid-Cap Growth U.S. Equity Opportunity ETF (FPX) up 1.32%, while the Vanguard Russell 2000 Small-Cap ETF (VTWG) has advanced 3.42% through April 12, 2018.
Compare these returns to the S&P 500 Index, which has declined 1.18% year to date.
Value ETFs
The SPDR Dow Jones Industrial Avg. ETF (DIA), representing Large-Cap Value is down 1.74% this year, the Guggenheim Mid-Cap Core ETF (CZA) is down 1.49% and the Powershares Russell 2000 Pure Value ETF (PXSV) is in negative territory, down 2.6%.
Ready to put relative strength investing to work in your accounts? Click the button below to schedule a consultation, or contact us through this site.
Tags

Get Our FREE Guide
How to Find the Best Advisor for You
Learn how to choose an advisor that has your best interests in mind. You'll also be subscribed to ADAPT, Avalon’s free newsletter with updates on our strongest performing investment models and market insights from a responsible money management perspective.
