
Related Blogs
February 9, 2018 | Michael Reilly
 “Blockchain stocks” — the majority of which are categorized in one of two sectors, Technology and Finance — were not immune to the recent market pullback.
Reality Shares Nasdaq Next Generation Economy (BLCN), a passively managed ETF that tracks an index of global companies involved in blockchain technology, fell 7% between Friday and Monday.
By comparison, Overstock.com (OSTK), a company at the forefront of the blockchain story, fell 25.73% in that timeframe.
What happened?
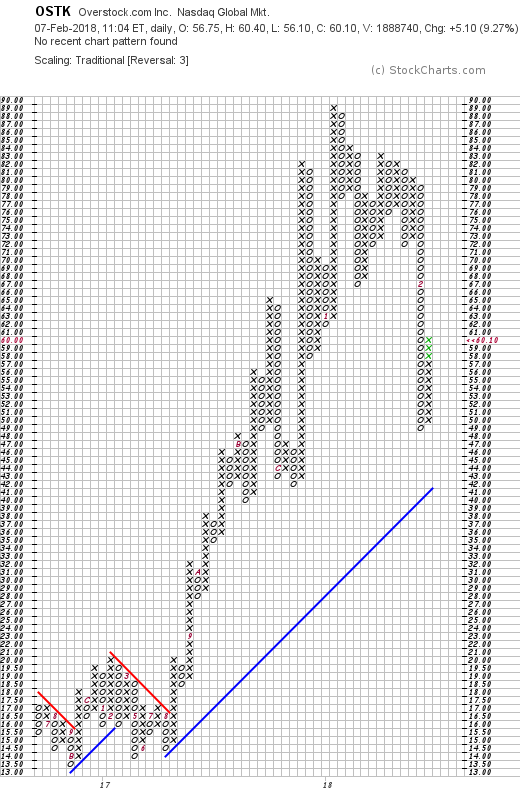
Overstock’s stock price broke down in a very powerful bearish technical pattern called a “spread triple bottom” on January 30, a few days before the broader market decline.
As one of the most direct crypto plays listed on the NASDAQ, OSTK was already suffering from negative moves in the cryptocurrency market. Then on Friday, the bottom fell out:
If the maxim holds true that the biggest gainers before a pullback also see the biggest gains after recovery, OSTK could again soar.
After all, OSTK more than tripled between September and early January. Even after the recent sell-off, it’s still a double in less than four months:
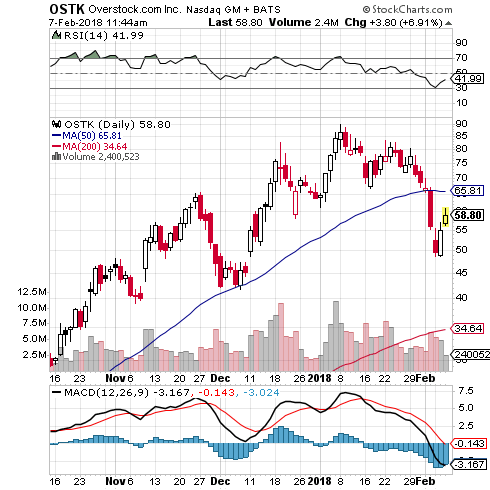
After a stock gets hammered like this, it will typically have to then go through a bottoming process. But we can see the stock regaining its strength and making another strong push higher. The stock was up 11.1% as of closing bell Tuesday, and inched higher on Wednesday.
A case could be made that it could indeed triple again from here. Who knows. We won’t speculate.
Following Technical Analysis, an investor might have sold their positions in OSTK on January 30 at the spread triple bottom, avoiding the 25.73% losses that came a few days later. Then the investor might wait for an uptrend, and get back in at the next RS buy signal.
Is the RS buy signal here? In a word, no. Not compared to other blockchain stocks.
Let’s take a look at a relative performance comparison of OSTK and BLCN, the blockchain index ETF mentioned above. When the chart declines, Overstock is underperforming the Blockchain benchmark Index. When it advances, the opposite is true.
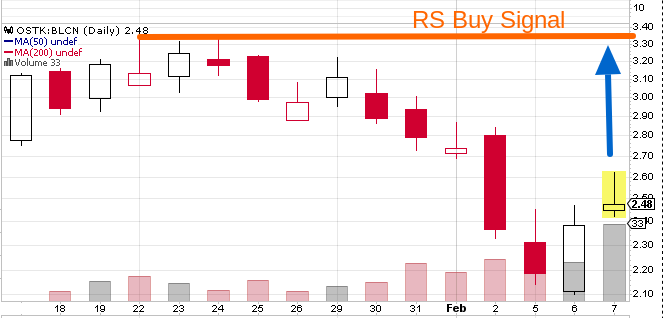
OSTK is strengthening, compared to BLCN — but it’s not yet time to buy. We’d want to wait until OSTK surpasses its last high ratio of 3.35.
(And for the record — there are much stronger ETFs that have exposure to blockchain and cryptos than BLCN.)
OSTK is volatile, and deserves a watchful eye. And the Blockchain Boom Model as a whole has more inherent risk than other models at Rowe Wealth Management.
But for those investors with the risk tolerance — who want exposure to any upside gains from the biggest technological and economic disruptor since the Internet — we believe it could yield substantial rewards.
To find out if you are a good candidate for the Blockchain Boom Model, schedule a consultation here.
Tags

Get Our FREE Guide
How to Find the Best Advisor for You
Learn how to choose an advisor that has your best interests in mind. You'll also be subscribed to ADAPT, Avalon’s free newsletter with updates on our strongest performing investment models and market insights from a responsible money management perspective.
