
Related Blogs
April 12, 2022 | Avalon Team
 Trees don’t grow to the sky and markets don’t go up forever.
Over the course of a lifetime, an investor is likely to experience both bullish and bearish cycles.
As defined by Investopedia: “A bull market is a market that is on the rise and where the conditions of the economy are generally favorable. A bear market exists in an economy that is receding and where most stocks are declining in value.”
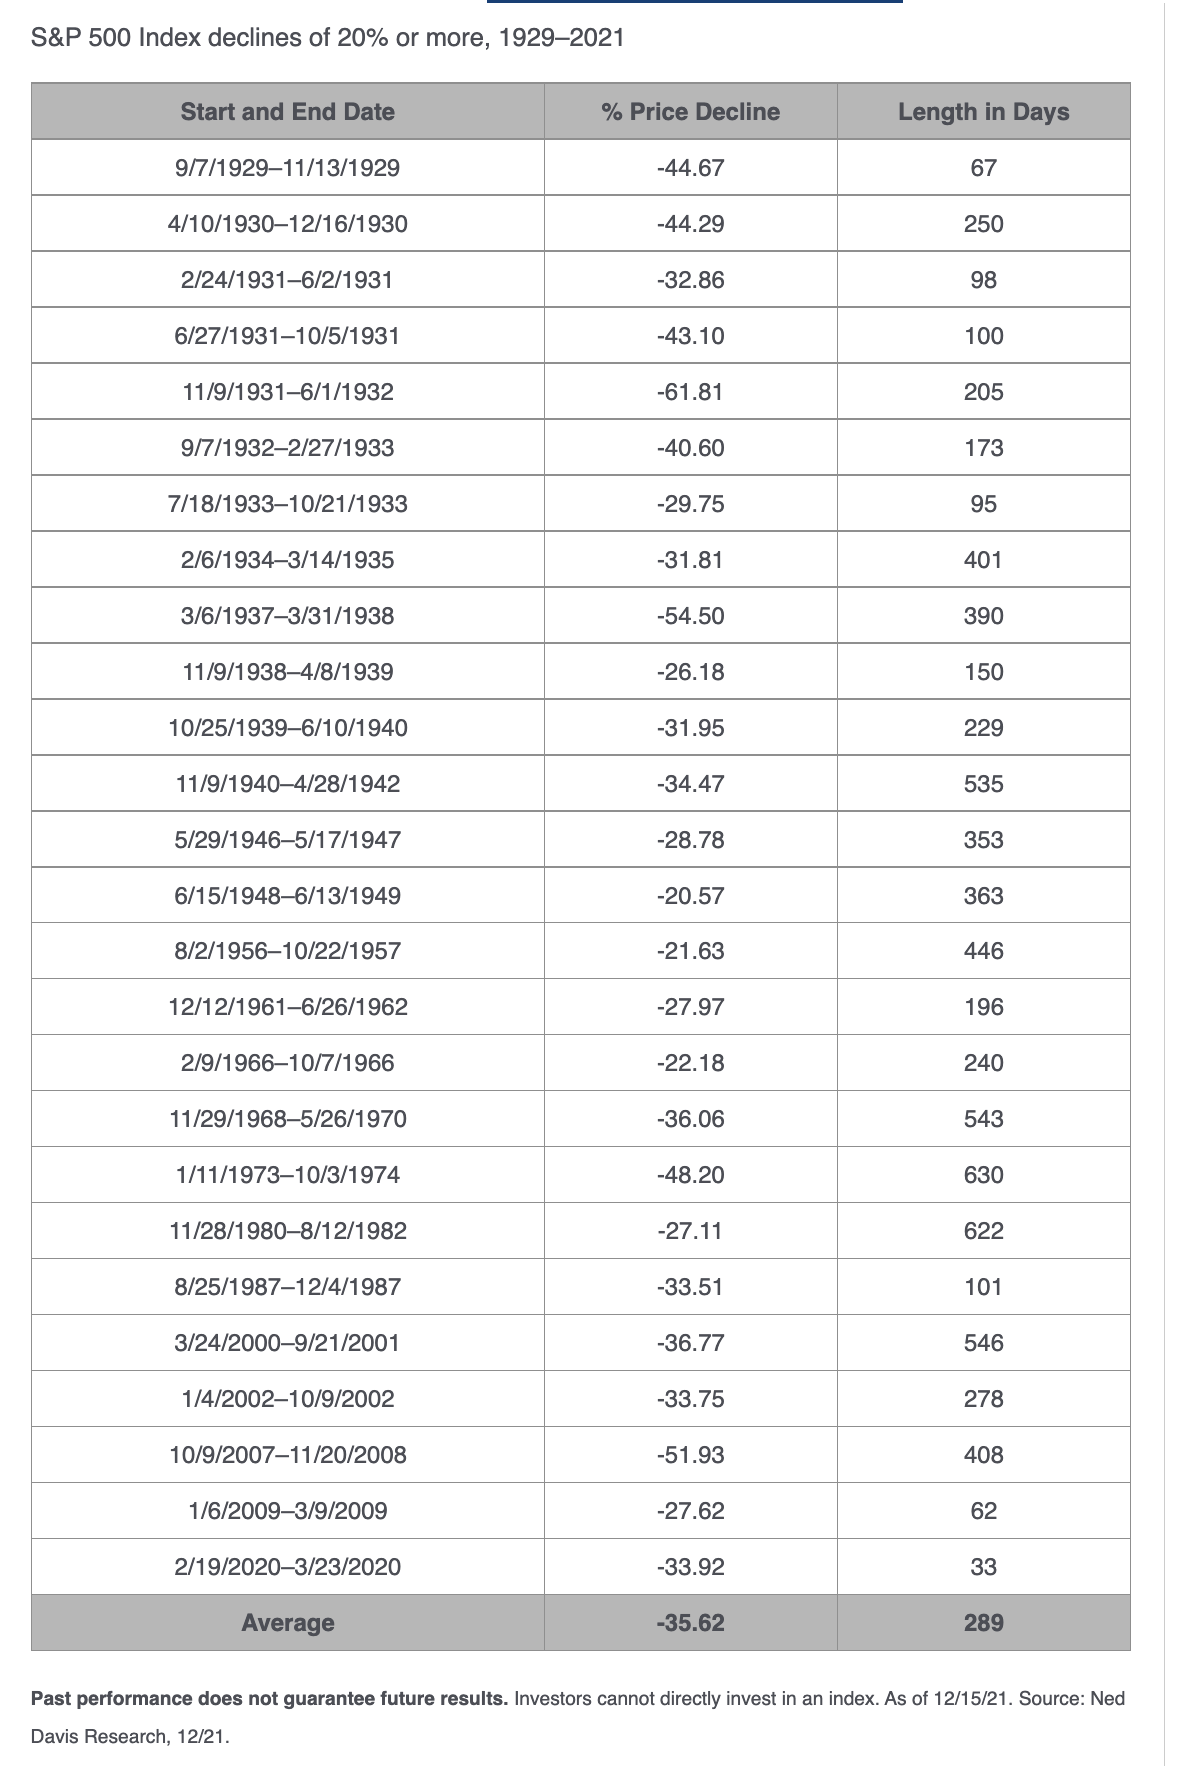
Historically, there have been 26 occurrences since 1929, when the stock market has fallen by 20% or more.
What makes bear markets somewhat deceptive is that they often begin very stealthily.
Prices will continue going up while the market internals begin to erode – exactly as we have witnessed over the past 12 months.
In the chart below, the percentage of stocks above their 150-day (30-week) moving average has been steadily falling.
This means that as the market peaked in early January of this year, it did so with much fewer stocks that were in uptrends.

This divergence was evident across a large number of internal indicators that we follow.
Investors who were simply following price could have easily been fooled as the rug has been being pulled out from under investors’ feet for over a year.
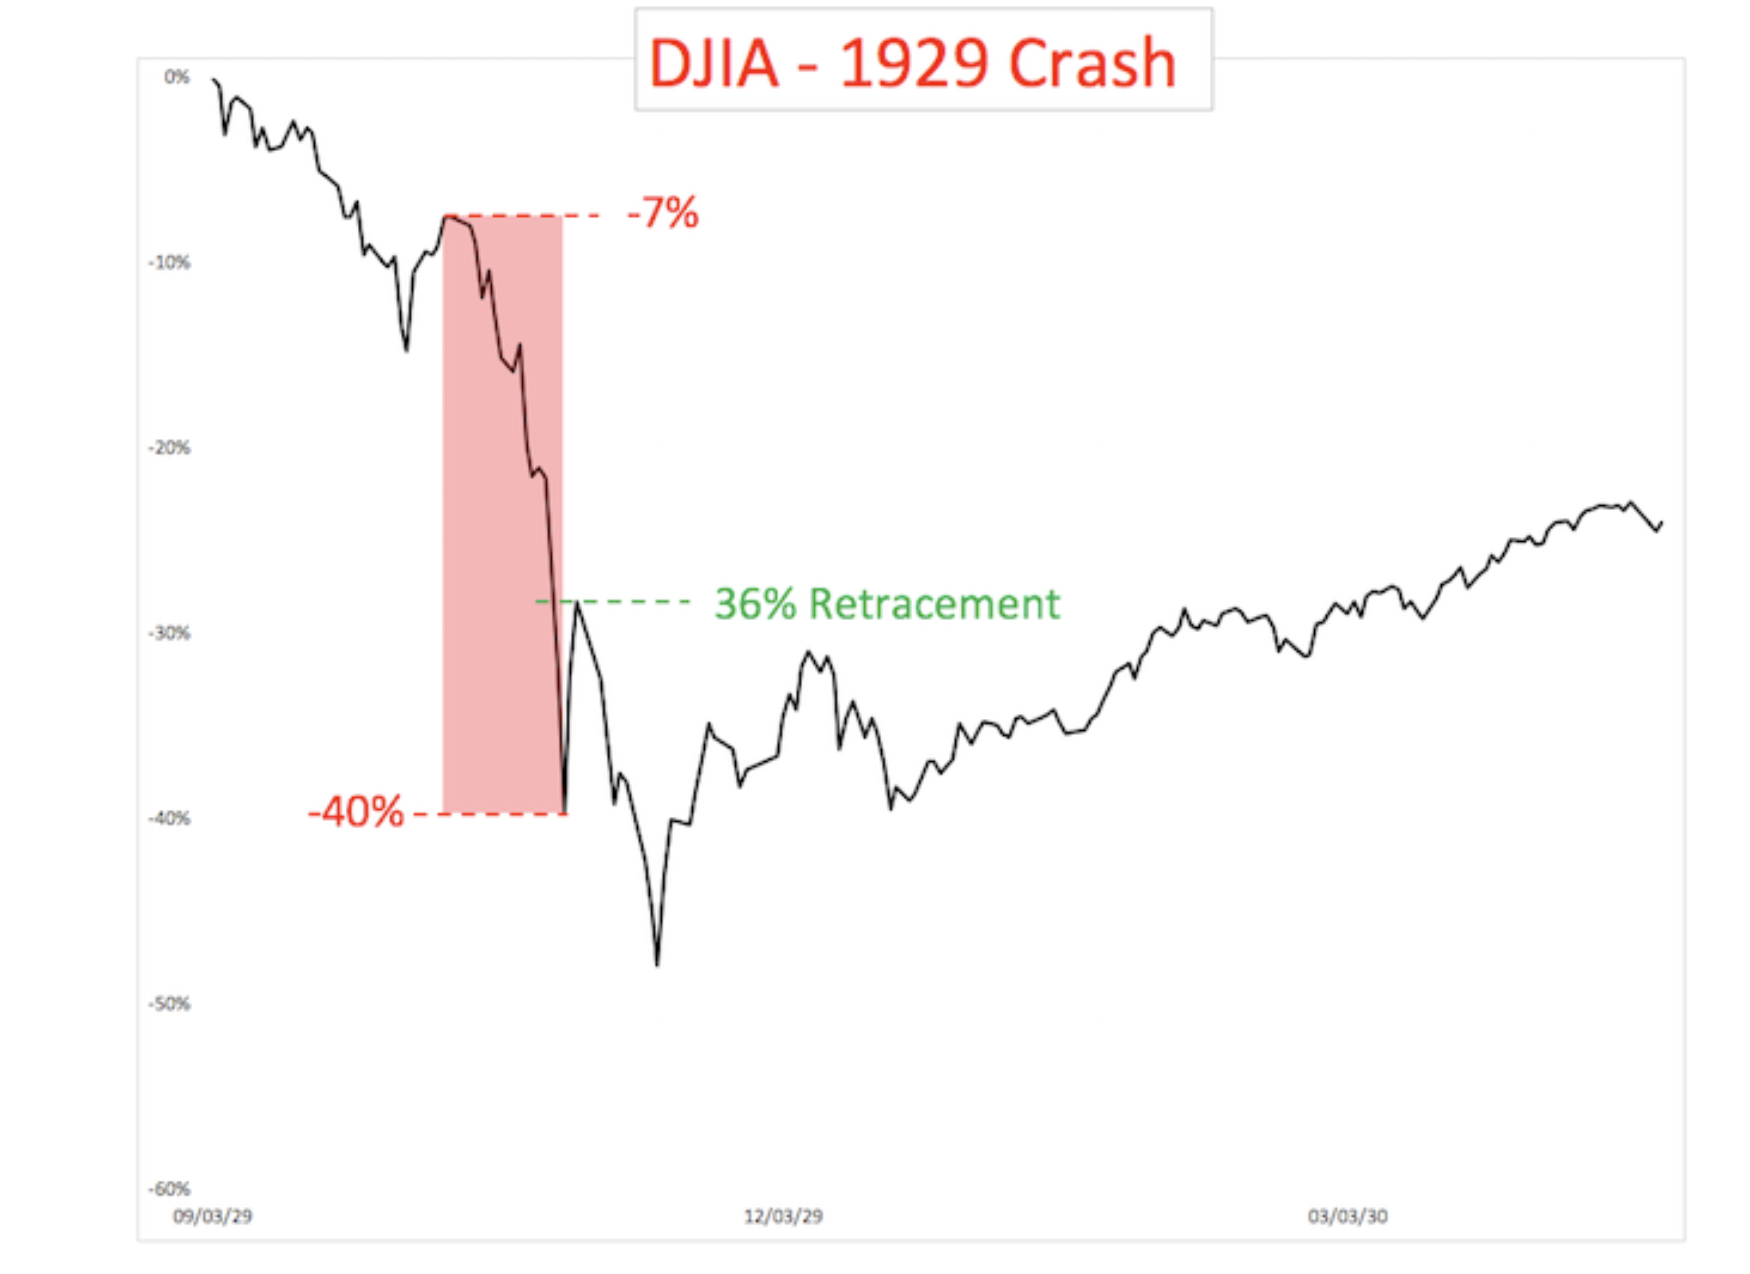
The other deceptive characteristic of bear markets is that some of the largest market rallies have occurred during bear markets.
For instance, in the 1929 crash, the crash phase lasted from October 10–29 and was then followed by a 36% rally, which then gave way to a drop to new lows.
In 2008, the initial decline was followed by a 24% retracement, which then gave way to fresh new selling.

Now it may seem puzzling to some that bear markets can spawn such large moves up, but it really makes sense.
First, there are many buyers who are hopeful that they just “caught the bottom.”
Second, there are those investors who sell “short” on the way down, and begin to panic and buy back their short stock, adding additional buying pressure.
This is how and why bear market rallies can look so impressive. In fact, half of the S&P’s strongest days in the last 20 years have occurred during a bear market…
Which brings me to our current market.
The January 4 high of 4818 was preceded by months of internal decay. The initial leg down fell just shy of -15% and was followed by a 12.70% rally to the recent high of 4,637.

I’ve seen many on social media calling for new all-time highs – the weight of the evidence suggests otherwise.
From a pure price perspective, the impressive rally of the last few weeks has backtested a two-year channel and reversed with a bearish engulfing candlestick pattern. This coincided with a close below both the .618 retracement level and the 20 SMA.
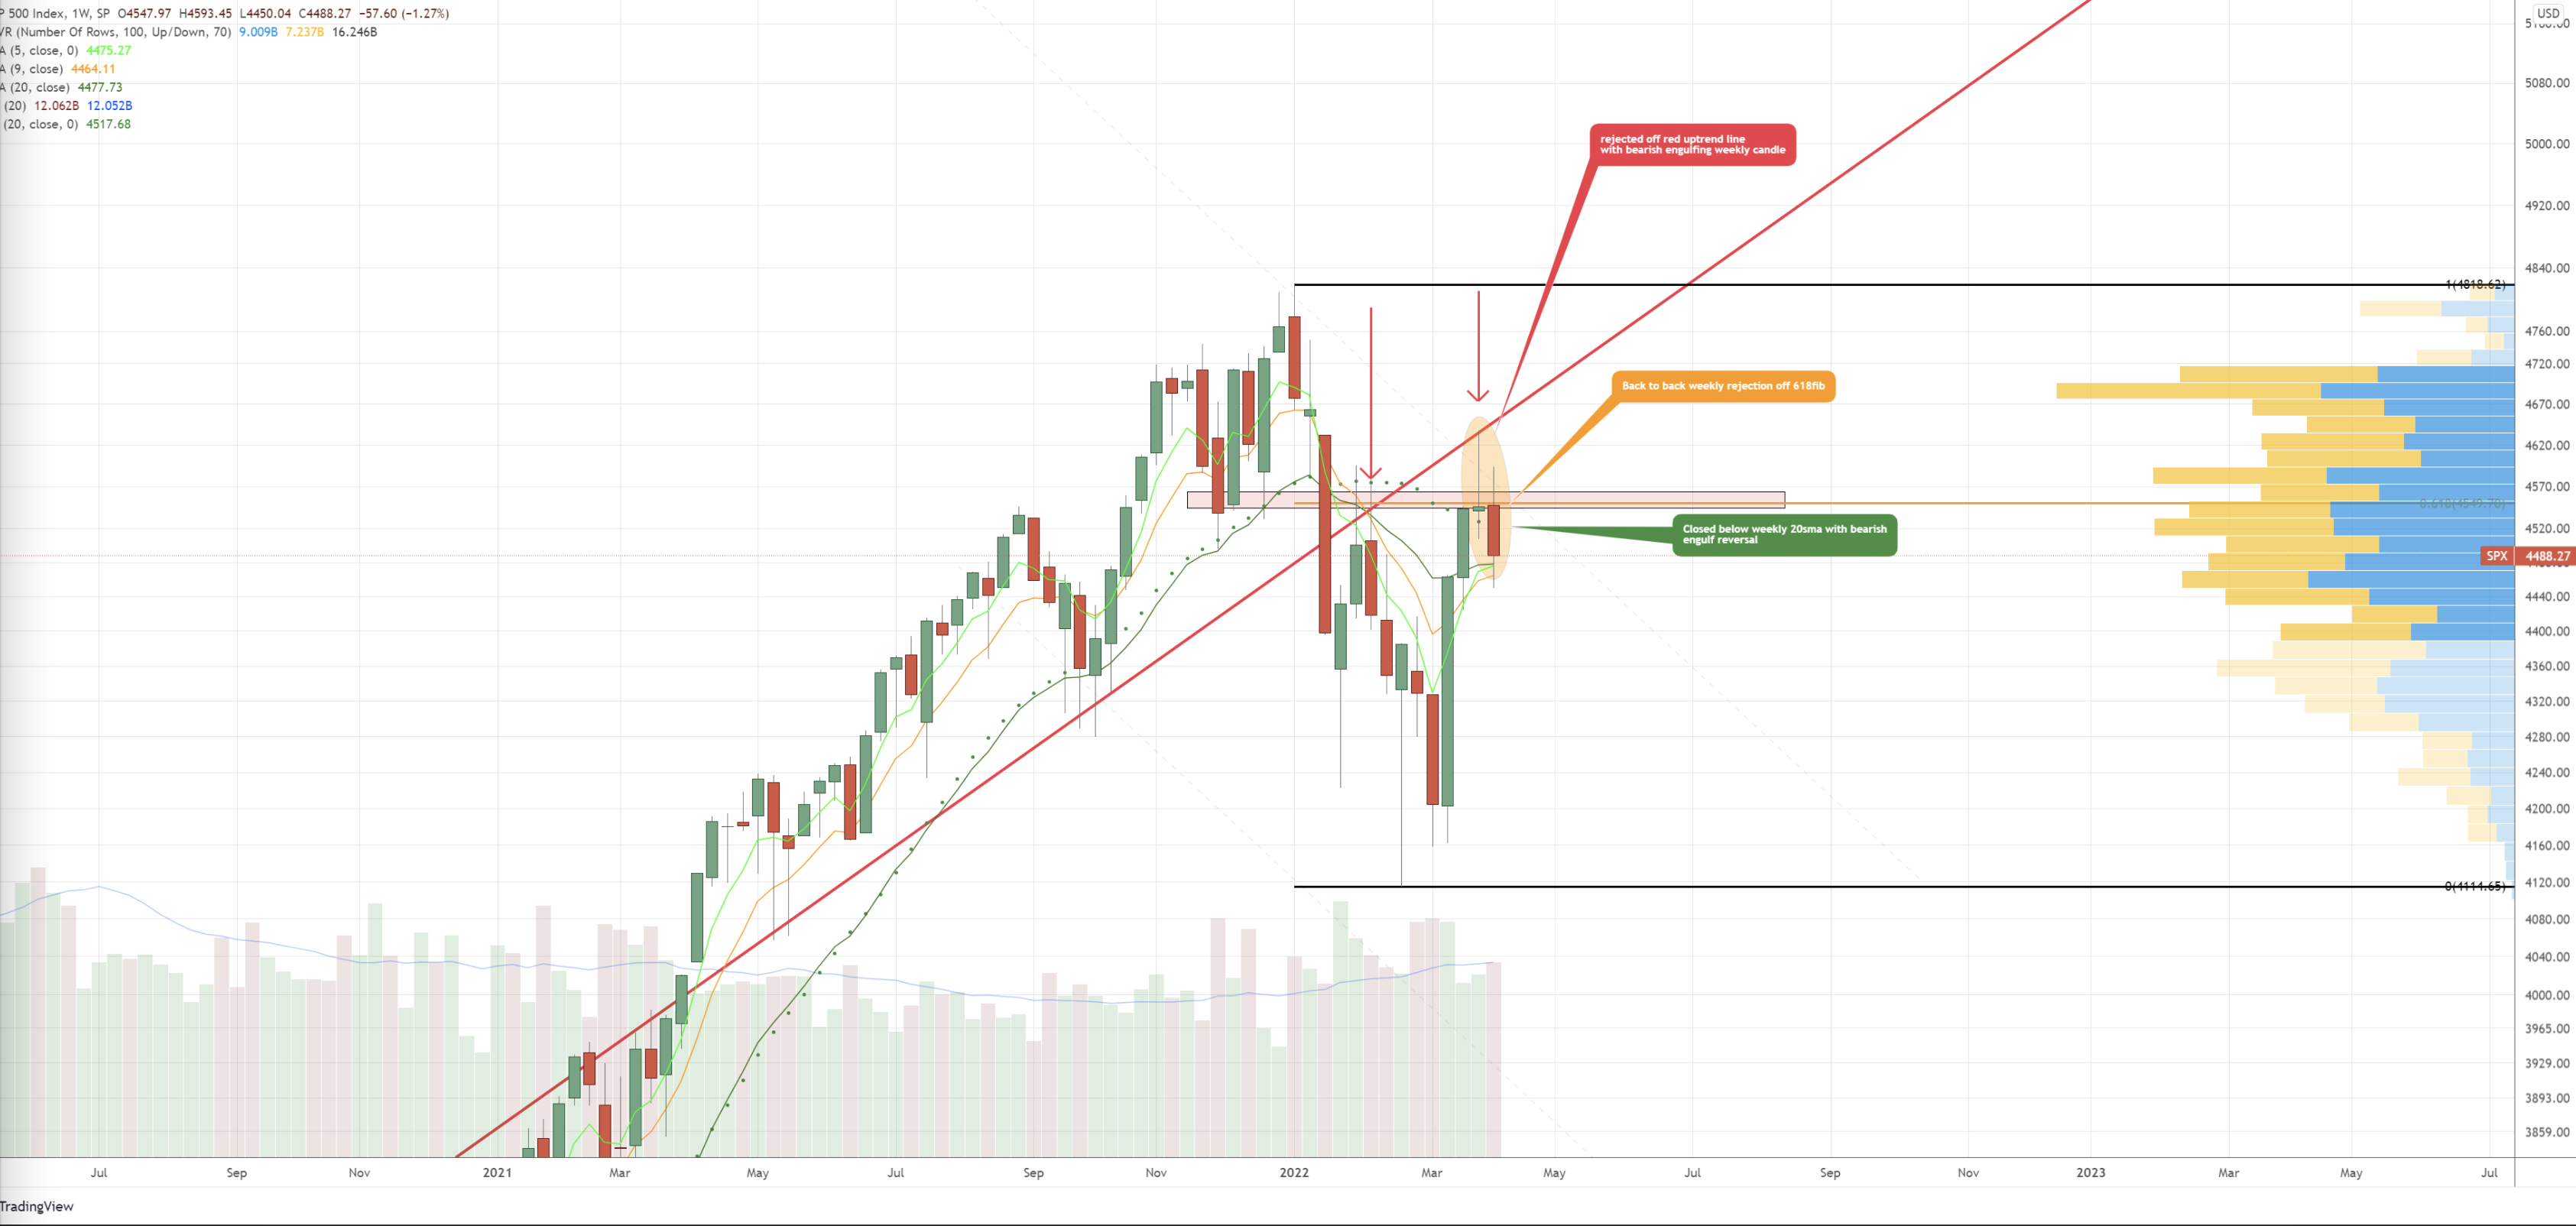
So the setup as we entered this week was looking more bearish than bullish.
Shifting to market internals, each of the key bullish percent indexes has reversed down in a column of Os, after yet again failing to reach a higher high.
Check out the Russell 2000 Bullish Percent Chart.
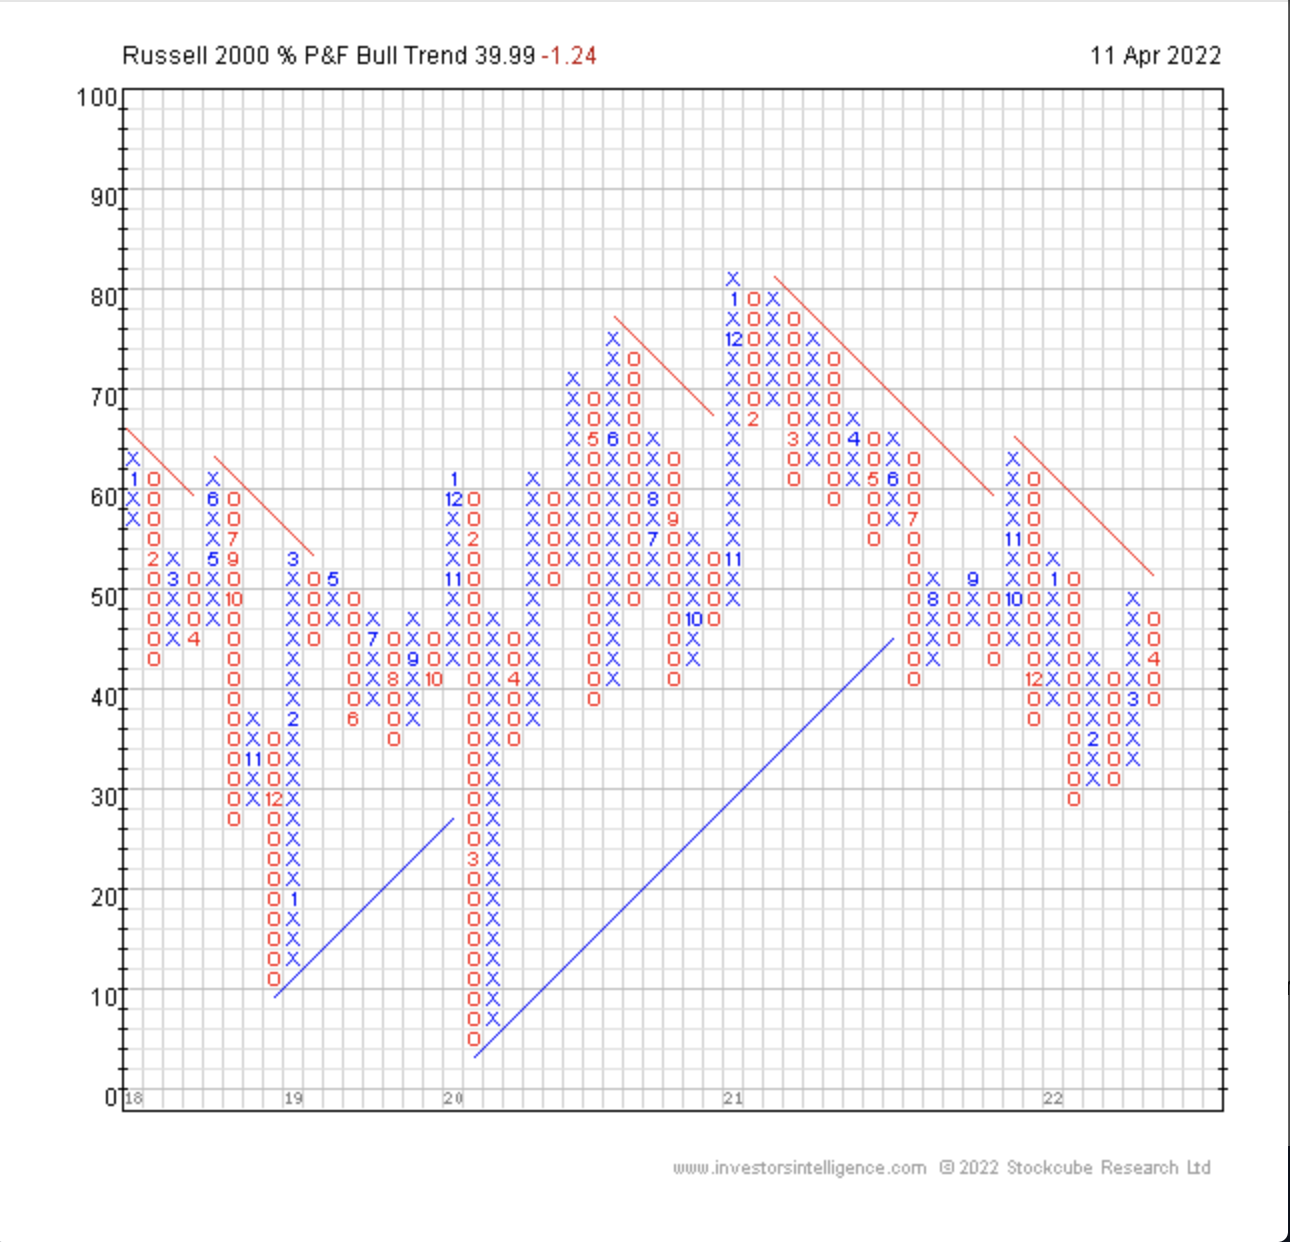
The S&P 500 Bullish Percent and the Nasdaq Composite Bullish Percent present similar messages telling us that institutions have used the recent rally to sell, not accumulate, shares.
This is bearish.
Looking further, the NYSE Advance-Decline line has rolled back over and failed to get above its moving average during the recent rally.
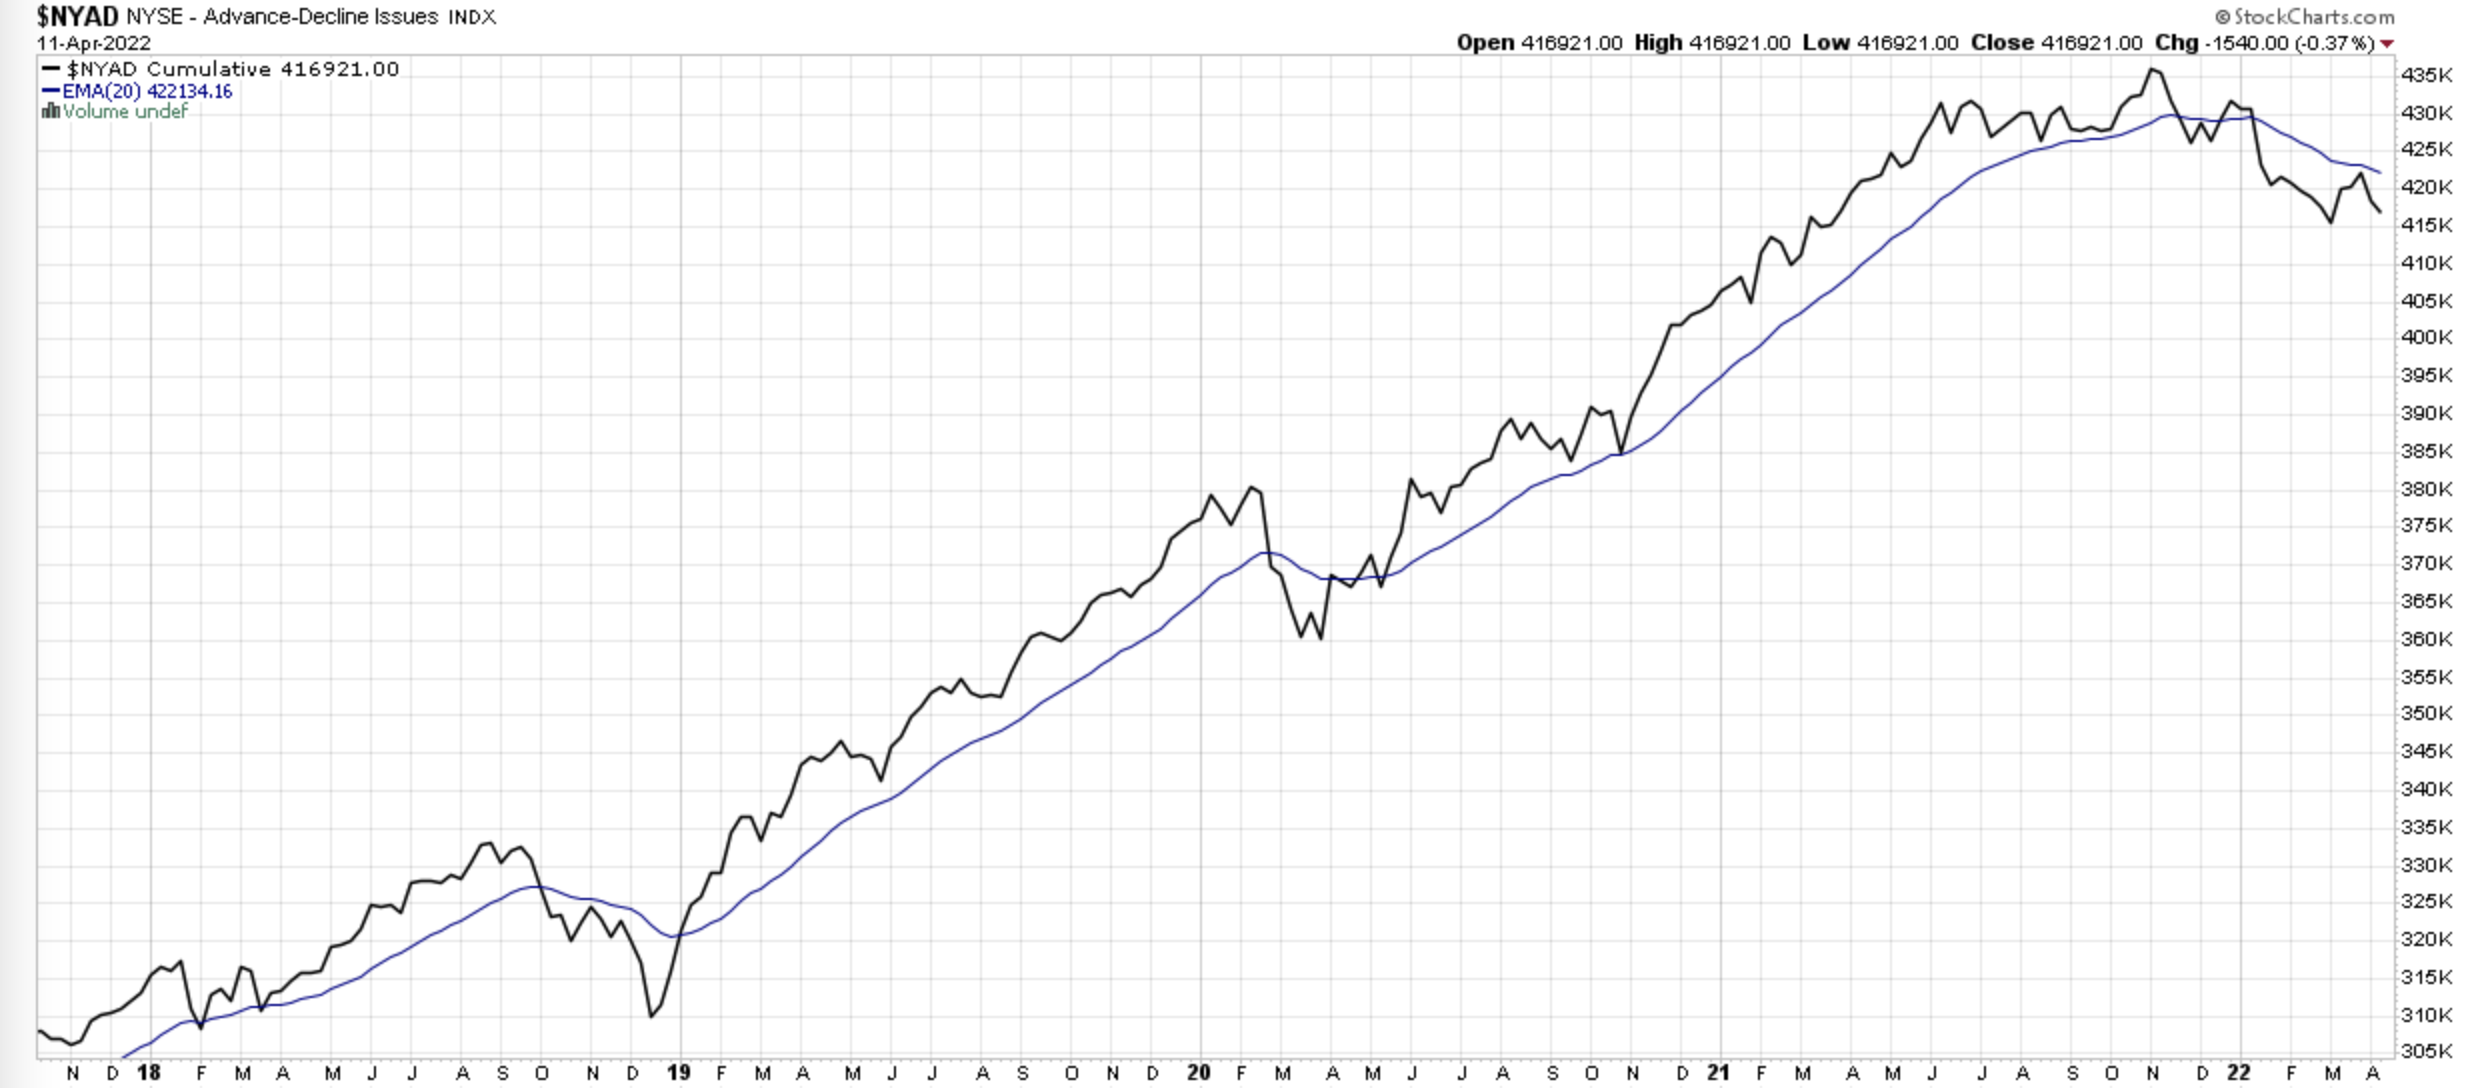
This too speaks to internal market weakness.
The Nasdaq Advance-Decline looks absolutely horrible. Note that this peaked over a year ago!

Sector Analysis
Sectors provide invaluable analysis given their interrelationship and significance to the overall economy. When you follow these relationships, you can easily see where the market is going.
Before each of the last three recessions and bear markets, consumer discretionary equities were significantly underperforming defensive consumer staples. The discretionary/staples ratio is now at its lowest level since the US election in 2020. The ratio is also diverging lower from the S&P 500, just as it did prior to the last three recessions.
The steepness of the white line is telling.
The JNK High Yield ETF hit new lows on Monday while the S&P 500 is still well above its March lows. Credit was never truly buying into the recent relief rally in stocks. Remember, credit tends to LEAD equities to the downside.
The SOX Semiconductor Index as a whole is now just above horizontal support at the 2022 lows set back on March 14. Semiconductors are now down -22% YTD.
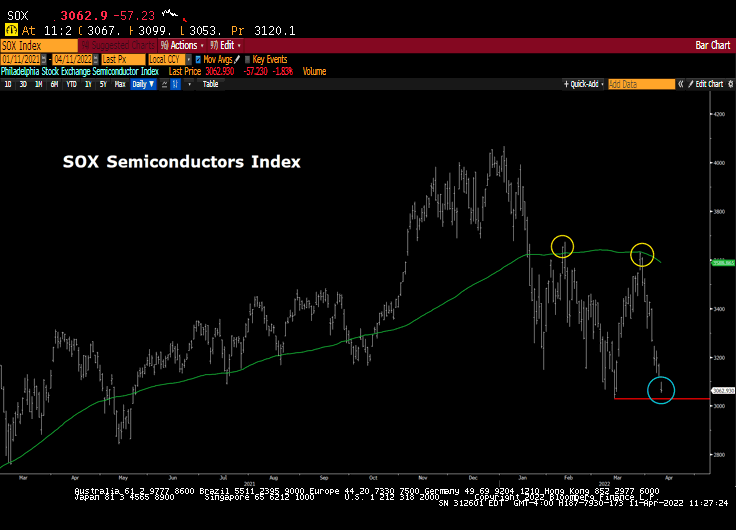
The semiconductors are considered an important bellwether for technology in general and the industry plays an important role in the overall economy.
The Home Builders (XHB) is a sector I have been especially bearish on. Coupled with extreme construction costs and higher mortgage rates, new homes have become unaffordable for many.
The XHB Homebuilder ETF is not only in a downtrend but is accompanied by heavy volume as well. This sector exemplifies the growing problem of stagflation where the consumer is unable to keep pace with rising inflation costs.

One particular worrisome tell is the recent weakness in the Transports. A reliable measure of the supply versus demand, IYT tells us if goods are moving or not. What we do not want to see in a strong economy, is for supply to outweigh demand. IYT tells us about that relationship, hence, about the health of the US economy.
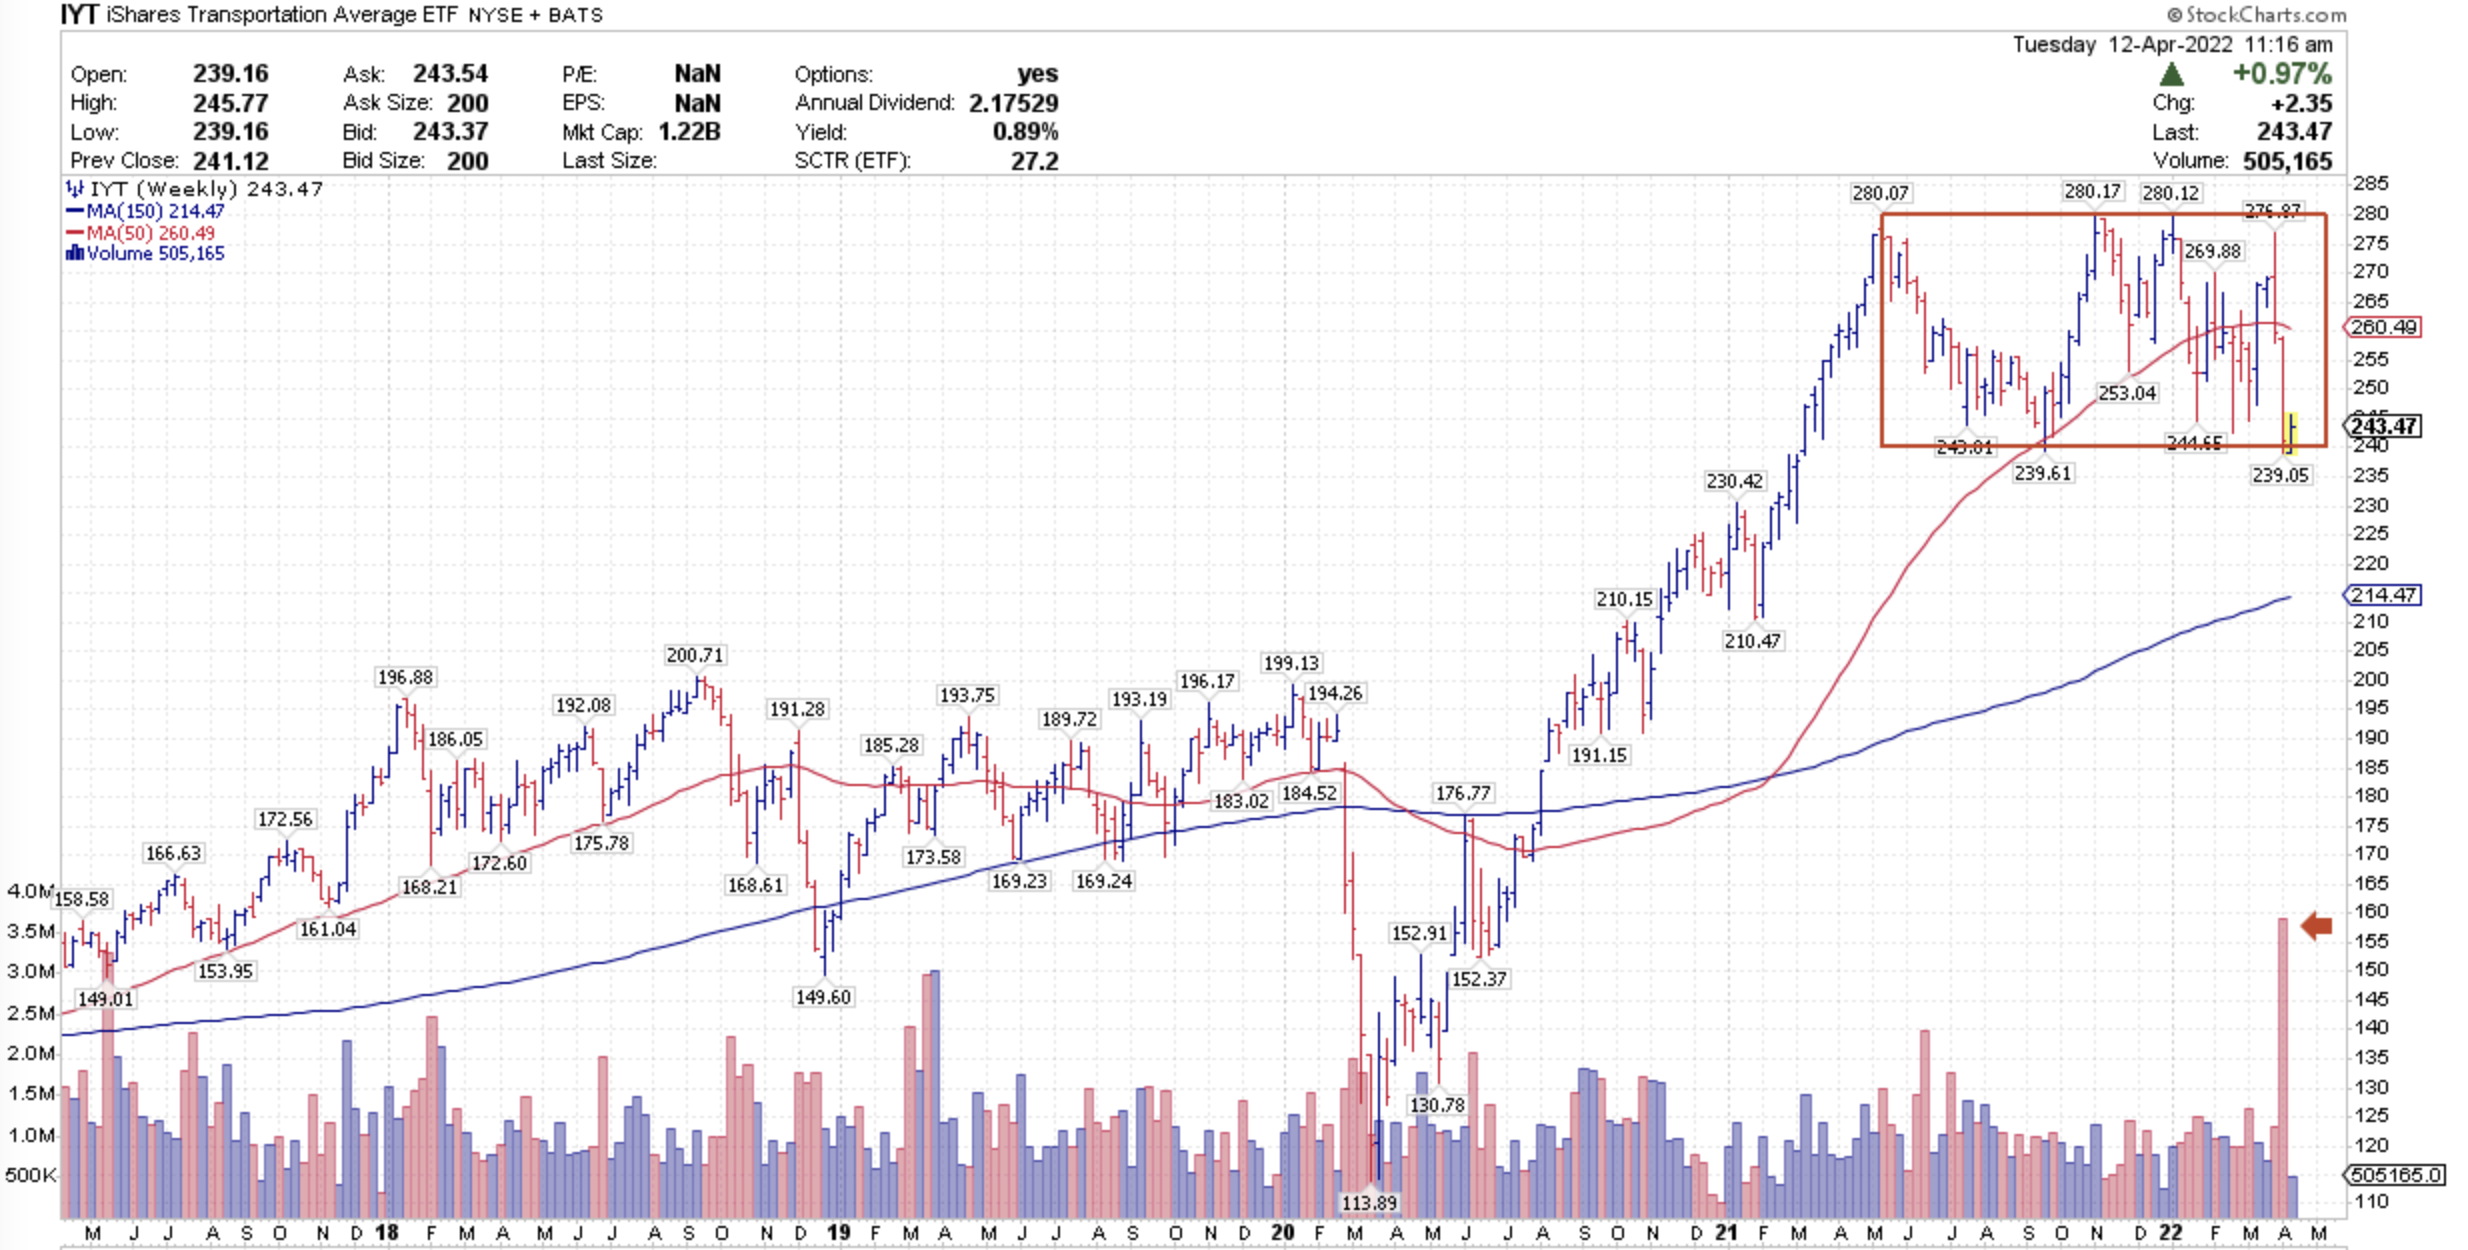
According to Dow Theory, any rally in the Dow Industrials must also be accompanied by price strength in the transports. The recent weakness in shares of IYT was accompanied by the highest selling volume seen in several years – and a break below the recent low would solidify a major top for this critical sector.
Inflation is here.
You can see it everywhere you spend – food, travel, even used cars. Nobody is immune.
Today’s print of 8.5% CPI was the highest since 1981 and reflected price increases not seen in the U.S. since the stagflation days of the late ‘70s and early ‘80s.
Strong inflation means the Fed has to change policy direction to fight it. They now must tighten policy rather than loosen it to stimulate economic growth.
The Fed policy of the last 40 years was managed in a deflationary backdrop, but the backdrop now is inflation so that changes all of the rules.
Strong inflation changes valid investment strategy because stocks and bonds can correlate to the downside thus removing the diversification benefit of traditional risk management.
You need different risk management rules to control portfolio losses (see this investment resource for a smart solution).
Stocks tend to perform poorly during inflationary periods, which is counterintuitive to most investors’ expectations.
In summary, downside risk management is paramount at this time.
If you have any questions or have been considering hiring an advisor, then schedule a free consultation with one of our advisors today. There’s no risk or obligation—let's just talk.
Tags

Free Guide: How to Find the Best Advisor for You
Get our absolutely free guide that covers different types of advisory services you'll encounter, differences between RIAs and broker-dealers, questions you’ll want to ask when interviewing advisors, and data any good financial advisor should know about you and your portfolio.
