
Related Blogs
May 17, 2021 | Michael Reilly
 Check out the charts below – where we compare Offense to Defense. This is a tool to do a quick check-in on the overall health and direction of the current market.
Here, we compare the strength of the S&P 500 index – representing the asset class of U.S. Stocks (growth) to two defensive asset classes – Bonds and Gold.
These Intermarket relationships can tell us a lot about what’s happening under the surface. These R/S charts are part of the cheat code – if stocks are under pressure, you’ll see it here.
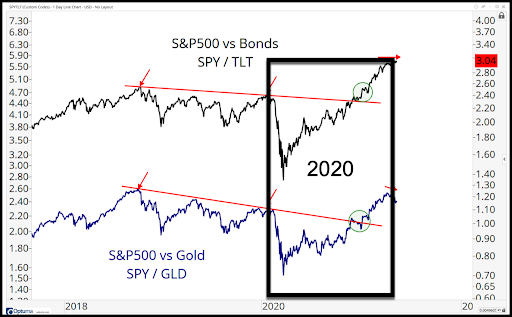
Last year (2020) U.S. equity markets were on an absolute tear, after bottoming from the COVID crash, stocks rose to new all-time highs. And that meant relative strength favored stocks over bonds or gold. We like to invest in things that are moving up to the right.
But, as I’ve repeated all too often already this year – this is not 2020. This is year two of this bull run. And true to form, growth stocks are messy and struggling to move higher.
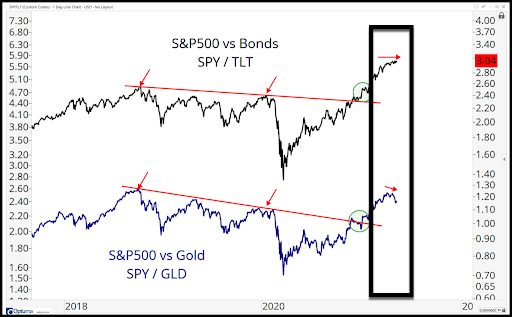
See how the SPY/TLT ratio chart is moving sideways, not up, indicating that stocks don’t have the same relative strength and momentum they had a year ago vs. Bonds. And stocks have already rolled over in the short-term relative to Gold, the other defensive asset class.
And here are last year’s sector leaders – Technology, Communications, and Consumer Discretionaries, all considered growth sectors, all are now lagging on both an absolute and relative basis to the more defensive Consumer Staples sector.
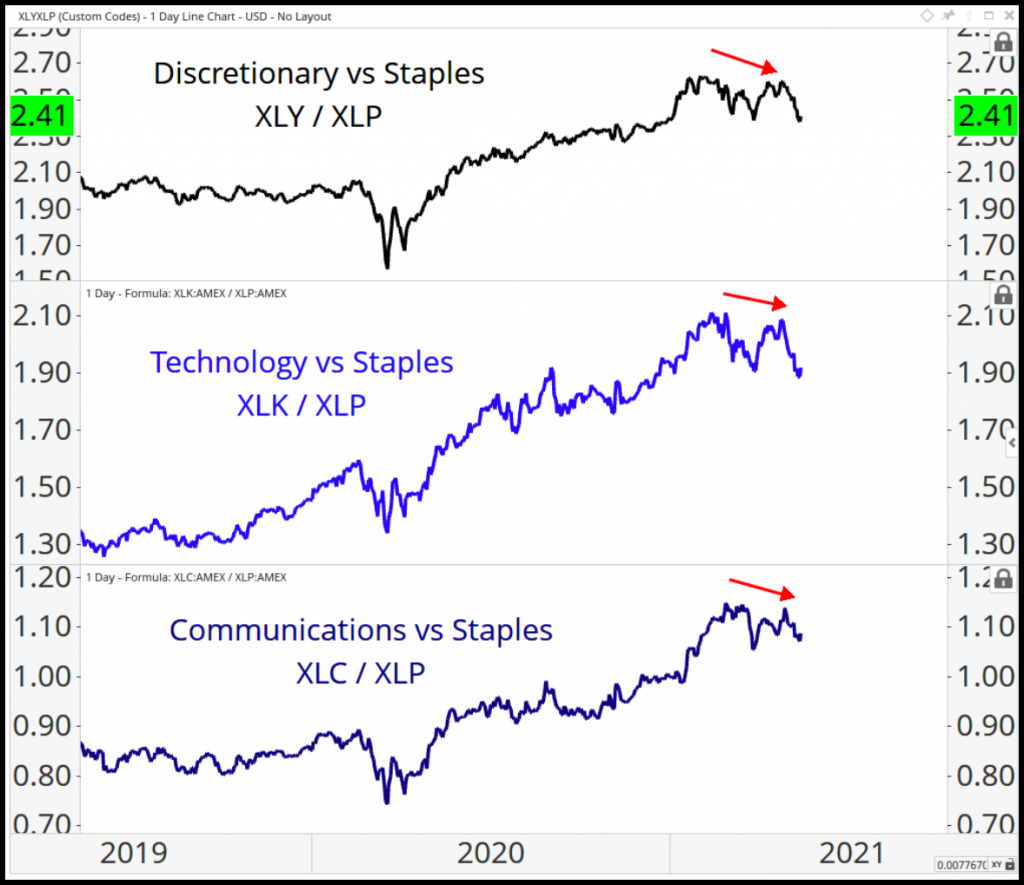
Staples are considered a safety/defensive play on U.S. equities – It’s usually not a good sign when growth stocks and former leaders, like Tech, Discretionaries, and Communications, can’t even keep up with Staples.
Will this last? That’s the million-dollar question, isn’t it? I don’t know how long it will last. This is what it looks like now, in the short term. It’s messy for stocks. Longer-term, Global equity markets remain in strong uptrends.
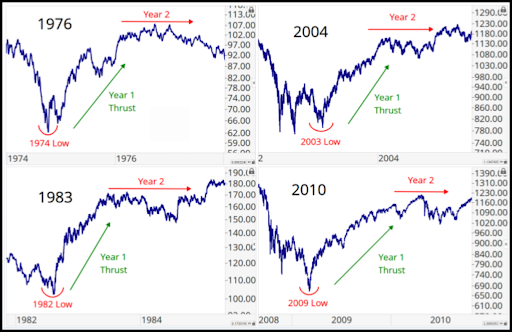
It doesn’t appear to be anything to panic about – just continue to adapt to what markets give you. We aren’t seeing anything happening in year two of this bull run that we haven’t seen in previous year two’s. It looked a lot like this in 1976, 1983, 2004, and 2010.
So the big question for investors is – how to play it. Investors with shorter-term time horizons may look to Bonds, Gold or even may decide to raise some cash. While long-term investors will continue to look at what has been working this year – Value over Growth and some of the more value-like sectors – think Financials, Basic Materials and the Commodities markets.
The answer really comes down to understanding what kind of market we are in and what your time horizon is. Align your investment decisions accordingly.
If you’d like more information about how we manage investor capital please click the link below to schedule a convenient time to talk.
Stay tuned for further developments!
If you find this of value and would like more information about our investment process, sign up for a consultation.

Get Our FREE Guide
How to Find the Best Advisor for You
Learn how to choose an advisor that has your best interests in mind. You'll also be subscribed to ADAPT, Avalon’s free newsletter with updates on our strongest performing investment models and market insights from a responsible money management perspective.
