
Related Blogs
July 20, 2022 | Avalon Team
We can just call today’s theme SUPPORT…
Because if what I’m about to show you doesn’t hold support, then the next few months could look a lot like the summer of 2008.
There’s a simple way to visualize the overall direction and strength of our equity markets through the lens of just five price charts.
As you know, we lean very heavily into Relative Strength relationships that exist between asset classes and their sectors.
However, Relative Strength doesn’t exist in a vacuum. We never want to overlook the direction of price. Ultimately, price is all that matters.
An argument can be made that most stocks peaked in the first quarter of 2021, even though the major market averages in the U.S. continued to grind higher into year-end.
However, selling pressure has been spreading throughout 2022 with more and more stocks moving to the downside.
Risk-off continues to sweep across global equity markets as a growing number of indexes and sectors either complete topping patterns or are violating key support levels.
My thinking is, if we have any real hope of stocks stabilizing and eventually showing signs of a recovery, then these key levels need to hold or reclaim former support.
Let’s start with the Russell 2000 (IWM).
Nothing good happens if small-caps are below their prior 2018 highs. The 170 area is the line in the sand.
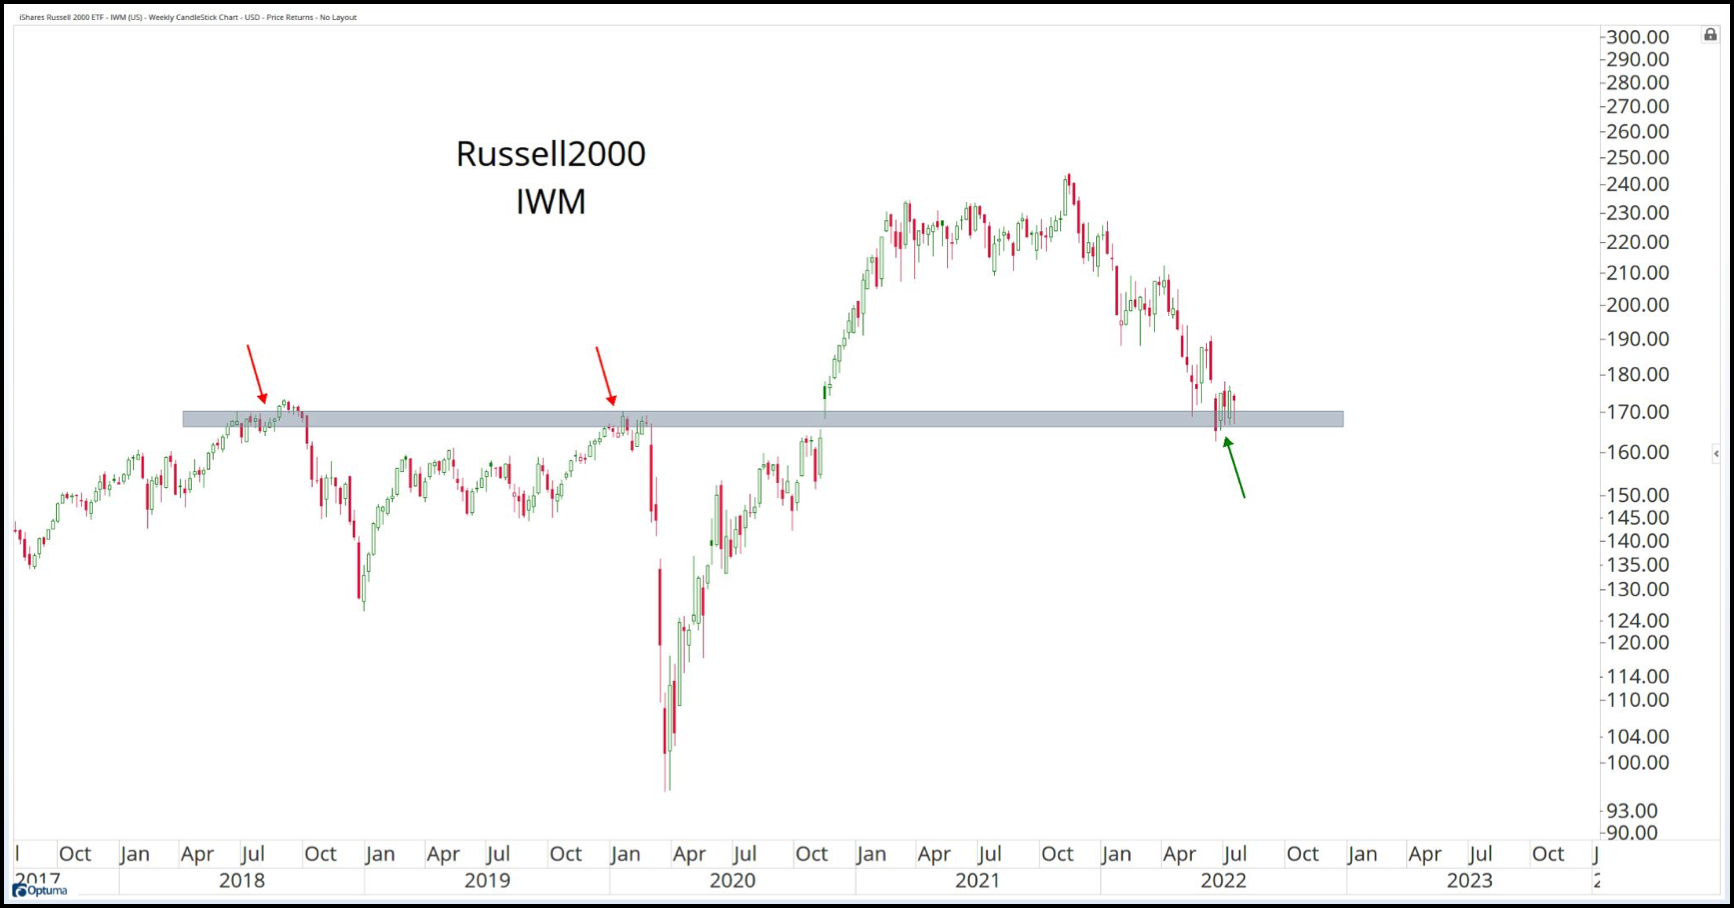
It took more than two years for IWM to finally break-out above its 2018 highs of 169, yet here we are, with small-caps rolling over and now retesting those 2018 highs (resistance).
If investors are looking for any kind of rebound in small-caps, I’d say the 170 level needs to hold.
Importantly, if IWM breaks below 170, there’s more risk to the downside.
Another index that doesn’t get enough attention and does a great job of illustrating how the average stock has fared is the Value Line Geometric Index (VALUG).
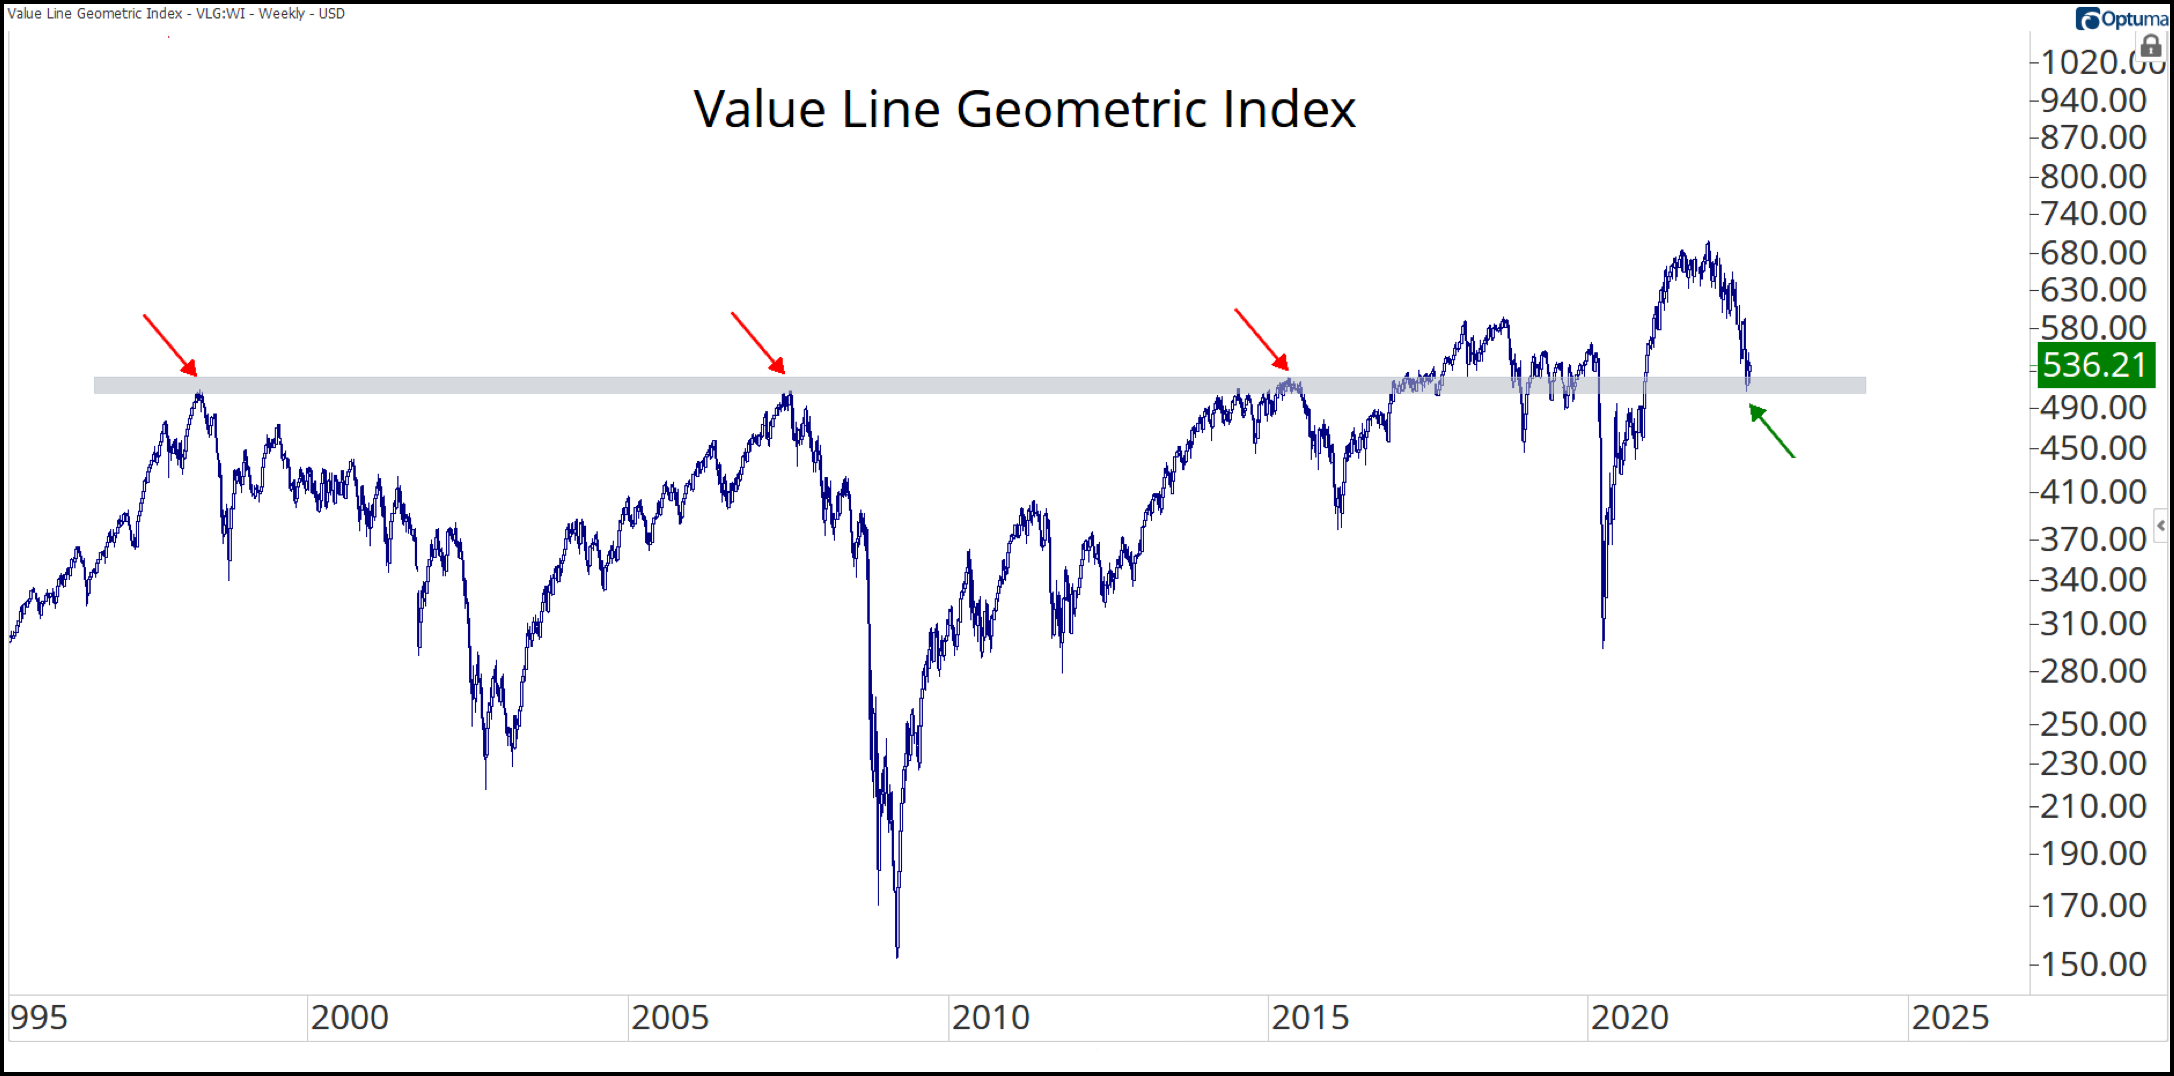
We want to see polarity at work here… in other words, bullish investors need to see prior resistance turn into support.
The Value Line Geometric Index has to hold around 530.
If the VLGI falls below 530 and cannot quickly rebound above overhead supply, the risk of owning stocks is elevated – and investors shouldn’t be surprised by another round of fresh selling to enter the market.
It’s no different in the next three price charts… it’s all about finding support.
Here, we’re looking at the DJIA, Dow Transports, and the Global Dow – all three completed topping patterns and all three now sit at important levels on the respective price charts.
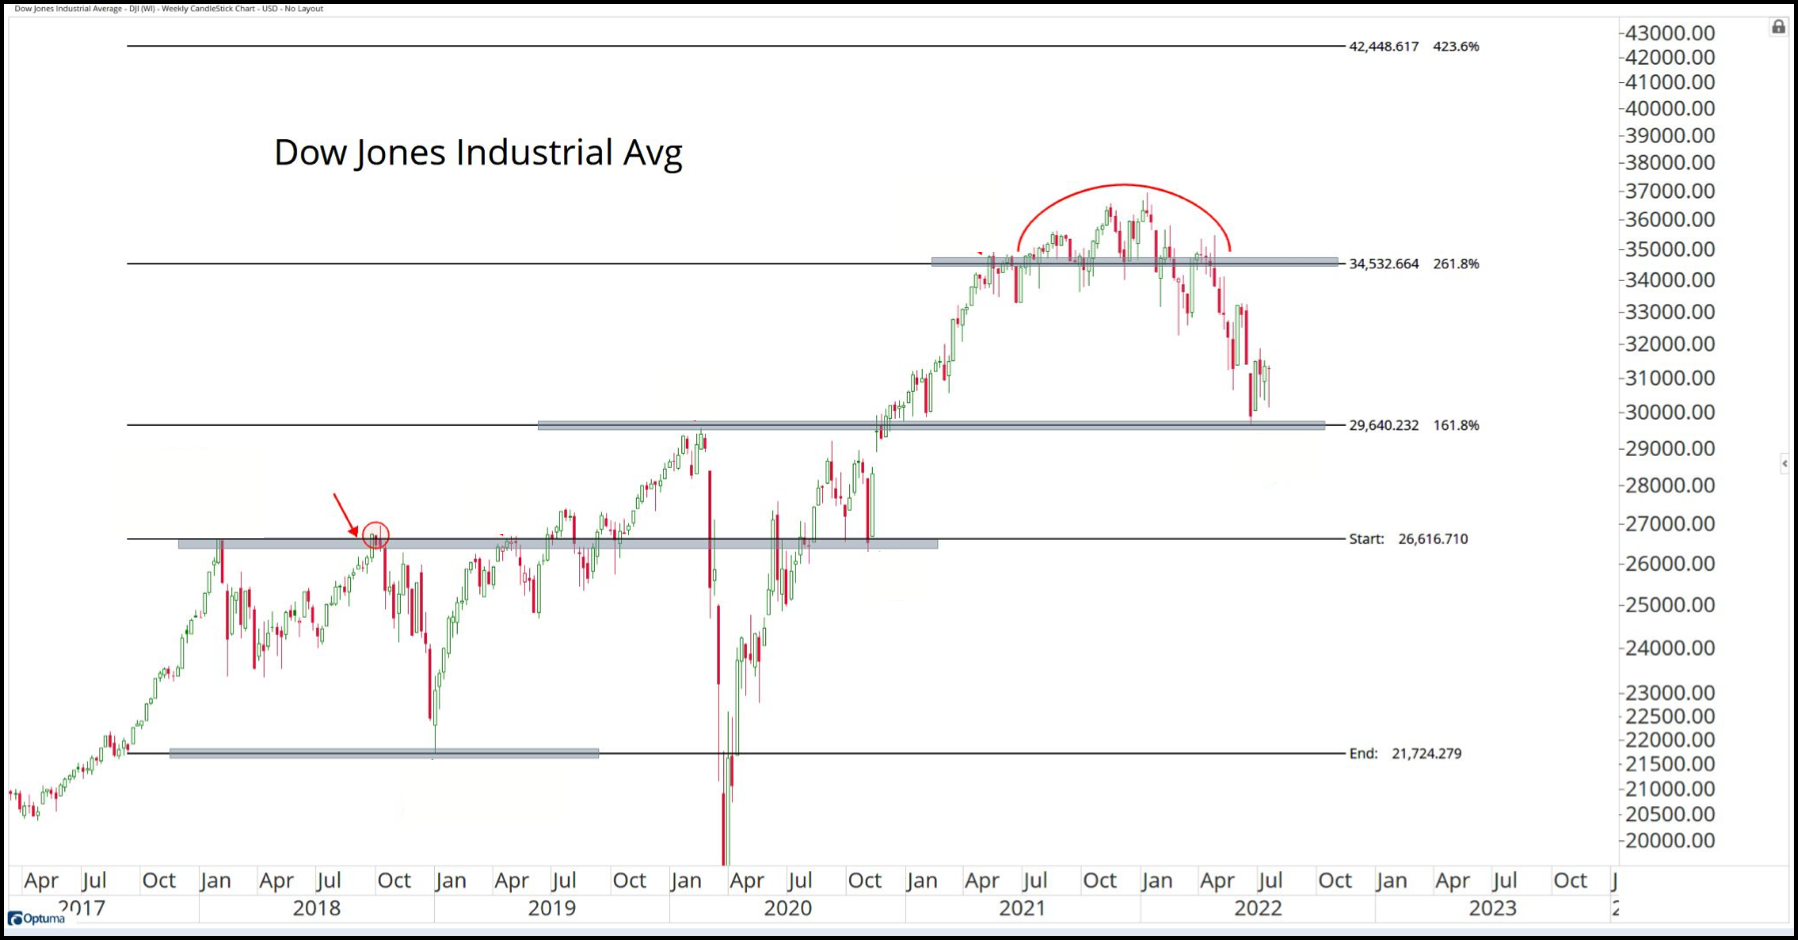
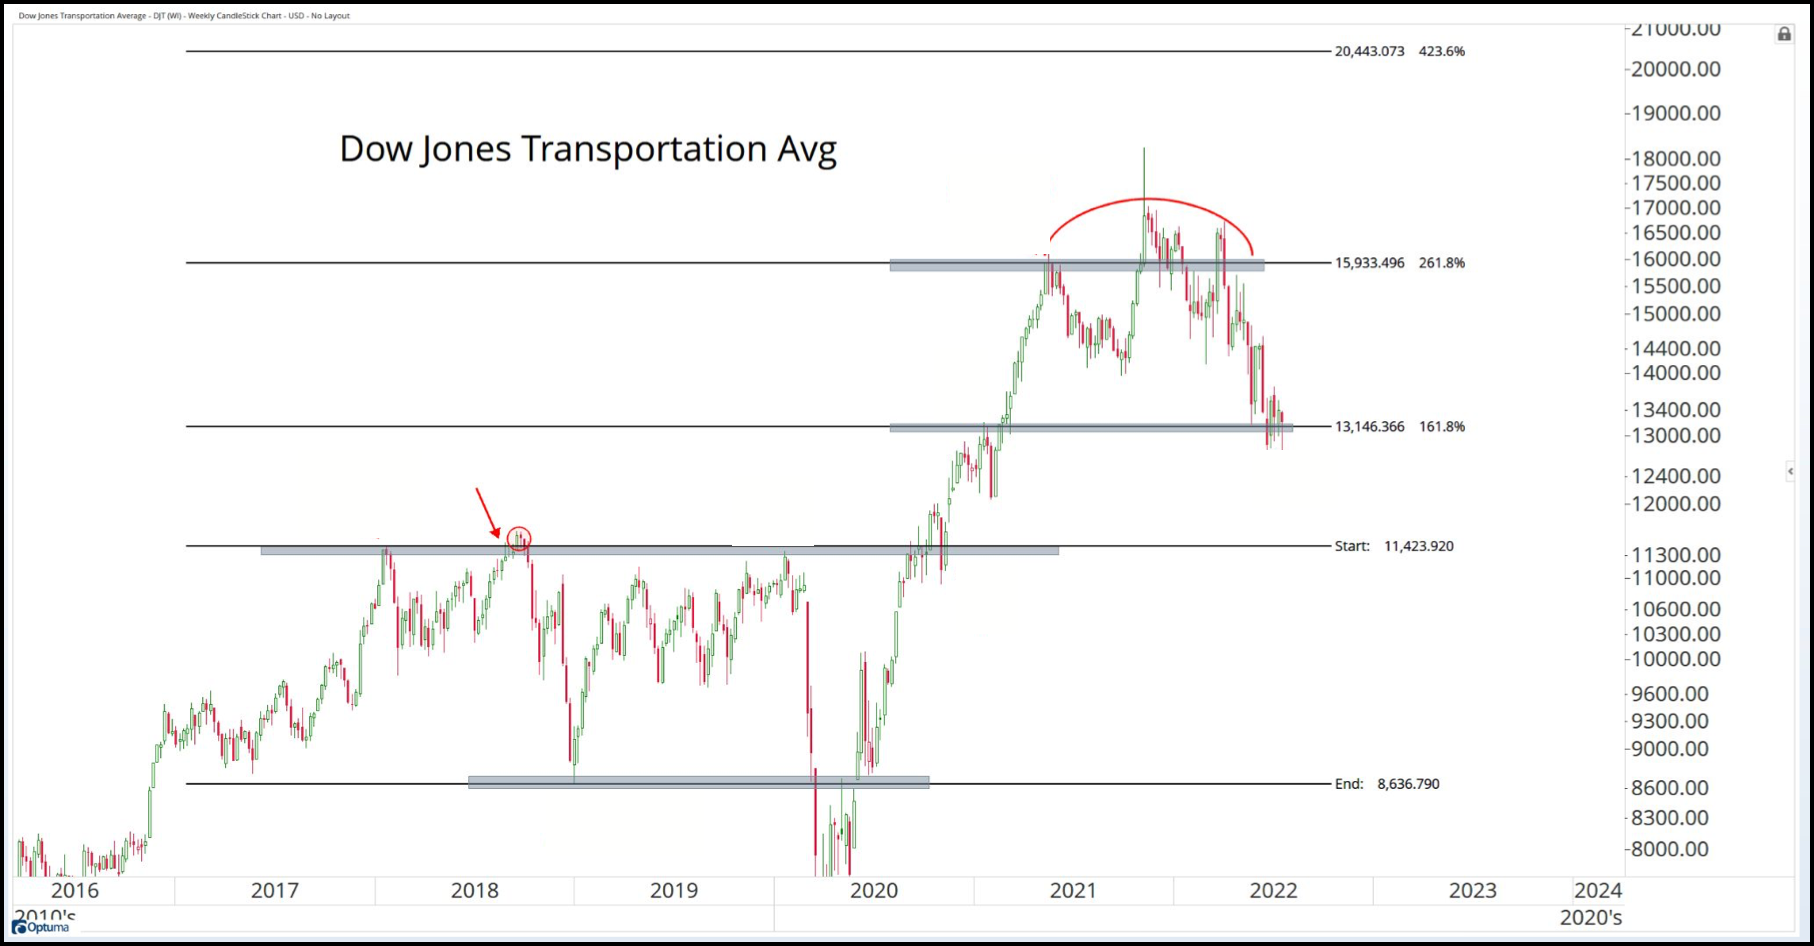

Investors want to be aware that any significant break below current support in this trio could spell further trouble for investors.
If you have any questions or have been considering hiring an advisor, then schedule a free consultation with one of our advisors today. There’s no risk or obligation—let's just talk.
Tags

Free Guide: How to Find the Best Advisor for You
Get our absolutely free guide that covers different types of advisory services you'll encounter, differences between RIAs and broker-dealers, questions you’ll want to ask when interviewing advisors, and data any good financial advisor should know about you and your portfolio.
