
Related Blogs
October 24, 2018 | Michael Reilly
Are markets signaling more turbulence for investors ahead? Or…is the sun hiding behind October clouds?
Yesterday, I was flying from our Boca Raton, Florida office to our Connecticut office.
I was enjoying a nice smooth ride when, suddenly, the fasten seat-belt sign came on and that nice smooth ride suddenly felt more like the wings were about to fall off!
That’s what this October market has felt like for most investors.
It’s been a hair raising, heart thumping experience.
And, much like travelers, investors want to know when the scary part will be over.
Well, here’s one indicator which may be signaling that an end to the turbulence is near..
It’s a short term technical indicator and is often looked at as a market timing tool by traders on the prowl for a buying opportunity – think of this as “sunnier skies”.
The NYSE Hi-Low Index measures the percentage of stocks trading on the New York Stock Exchange that are hitting new highs.
It’s very rare that this indicator brakes below 10%. When it does, it’s an indication of a very washed out market.
Let me explain…..
The chart below is a P&F chart, pay special attention to the two areas circled. These are the two most recent times the NYSE has fallen below the 10% level.
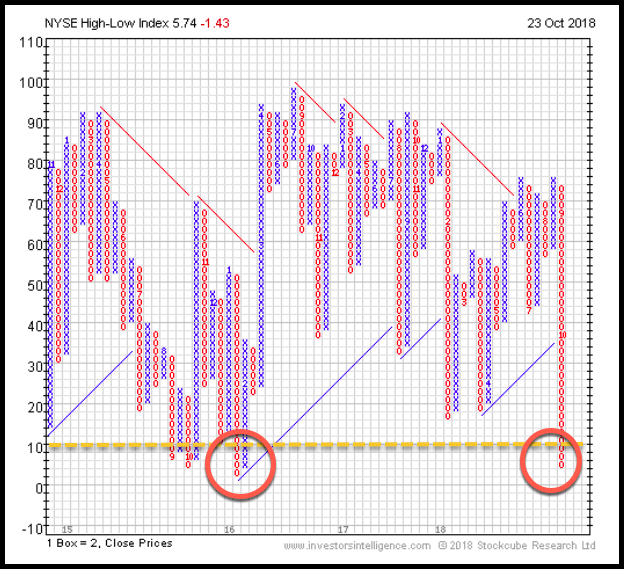
The indicator currently sits at just 5.74% (circled far right).
This means less than 6% of all the stocks that trade on the NYSE are hitting new highs.
To put it another way, nearly 94% of all the stocks that trade on the NYSE have broken to new lows.
We’re talking in the neighborhood of 2800 stocks that trade on the exchange.
And that means there has been a lot of selling going on the last three weeks – driving prices down.
In fact, you’d have to look back to 2016 to find the last time this indicator was at such oversold, washed out levels.
Prior to that, the NYSE broke the 10% level in 2009, 2011, and 2015. In fact, it’s only been this low seven times since 1995!
It just doesn’t get this low very often.
The thing is, this indicator provides an opportunity to invest in stocks on sale – assuming the turbulence you experienced didn’t ground you from investing ever again!
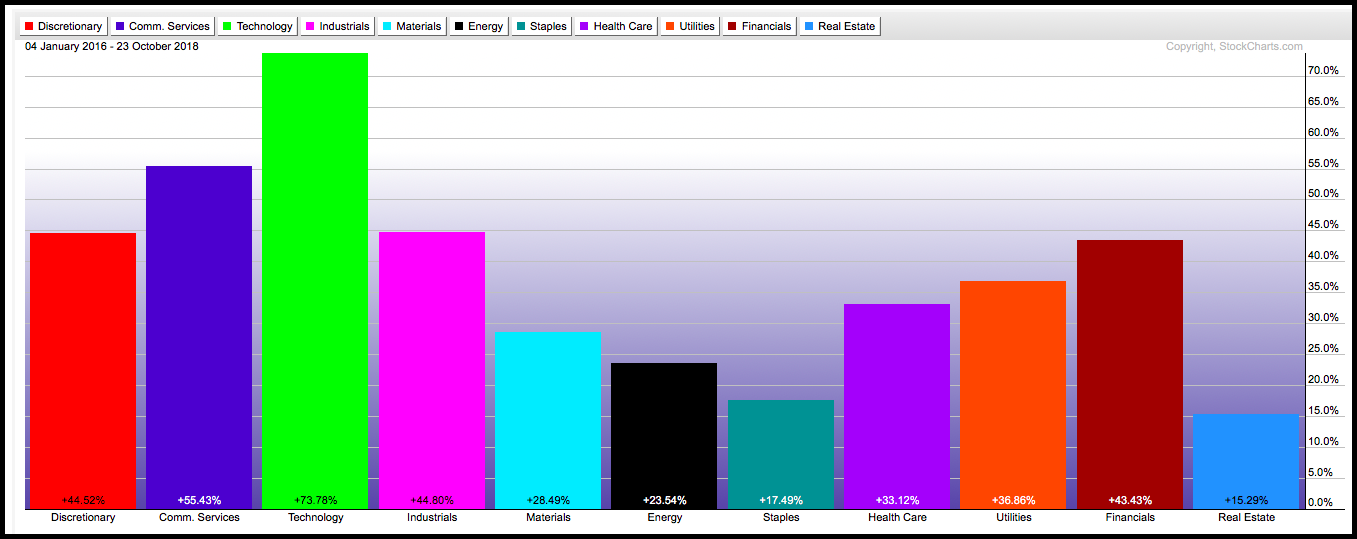
Take a look at the bar chart below. It’s an example of how sectors here in the U.S. performed since the last time the NYSE HiLo broke below 10%.
It’s a three year chart running between January 4, 2016 and October 23, 2018.
Four of the strongest sectors have had returns in excess of 40%, while XLK – our technology sector proxy – has grown by 73%.
Can I guarantee similar returns over the next three years? Of course not.
I can’t guarantee that the selling that has dominated the market these last few weeks is over. In fact, legally, we can’t even guarantee the price of coffee will stay below $10,000.00 for the next 5 minutes.
What I can tell you for sure is, throughout history, there’s been much less risk to the downside from a market this washed out (at such low levels).
At levels this low, it is extremely likely that most (not all) of the selling has already happened.
Two weeks ago in Adapt, I explained that all this selling is taking place during a time when the United States is enjoying historically low unemployment, rising corporate earnings, and one of the few growing economies on the planet.
Mr. Market is having a knee-jerk reaction to interest rate policy decisions by Federal reserve policy makers…
So, that’s been the primary source of investor concern and the driving force behind the most recent market correction.
Again, it’s the fear of what might happen, not a fear of what is happening.
All I can suggest is that your energy is usually best used focusing on what is happening now, rather than trying to guess what might happen in the future.
And the NYSE HiLow index is very clearly signaling a very washed out market – and one that may just be telegraphing opportunity to come..
Whether it was triggered by Fed interest rate policy, or other geopolitical concerns, the pullback has caused stock valuations to fall and become more attractive to investors.
Provided economic data remains firm, corporate profits continue to beat estimates, and the Fed continues to toe the line, then this pullback may form the foundation for a solid fourth quarter/year-end rally.
So, keep an eye on this short term market indicator and others, such as the NYSE 10% week for reversals off these current lows. If there’s follow through to the upside, this may be the opportunity traders have been waiting for.
Consider scheduling an appointment with one of Rowe Wealth’s advisors to see how we are taking advantage of this huge opportunity.
Our rules-based investment models force us to take advantage of sectors with the highest relative strength. We are happy to explain why they are in a good position to outperform the market as it swings back to the upside.
Click here now to see available call times.

Get Our FREE Guide
How to Find the Best Advisor for You
Learn how to choose an advisor that has your best interests in mind. You'll also be subscribed to ADAPT, Avalon’s free newsletter with updates on our strongest performing investment models and market insights from a responsible money management perspective.
