
Related Blogs
February 1, 2019 | Michael Reilly
After a turbulent fourth quarter, ending with a December that saw the S&P 500 have its worst showing in nearly 100 years, it’s fair to say investors were due for some good news!
And that’s exactly what we got on Wednesday, when Fed Chairman Jerome Powell announced what the market had anticipated – that key interest rates would remain unchanged.
At his news conference, Mr. Powell said “The case for raising interest rates has weakened somewhat…The U.S. economy is in good shape” and that the Federal Reserve would exercise “patience” as it weighs future rate hikes. Hallelujah!!!
This is welcome news for anxious investors! Until now, it seems like the Fed has been one of the biggest dangers to the market and the economy.
Leading up to Wednesday, there have been five rate hikes during the first two years of the Trump Presidency – four of them in 2018.
And with each rate hike came volatile stock prices and a fire storm of tweets from the President with Fed policy squarely in his crosshairs…
But the Fed is trying to walk a delicate line. Their job isn’t an exact science.
They want to be careful not to send the message that the economy is weakening – causing investors to hit the panic button and sending markets roiling – which is exactly what happened in December.
But at the same time, the Fed has a clear responsibility for prudent monetary policy – regardless of who likes it or not.
For now, we have Fed policy that is more dovish – a positive sign for markets that are taking comfort knowing future rate increases will only come after careful observation.
In other words – the Fed appears to have given markets the green light – and in doing so, possibly fueling future returns.
This year, we have already watched as markets have rebounded nicely off the December 2018 lows.
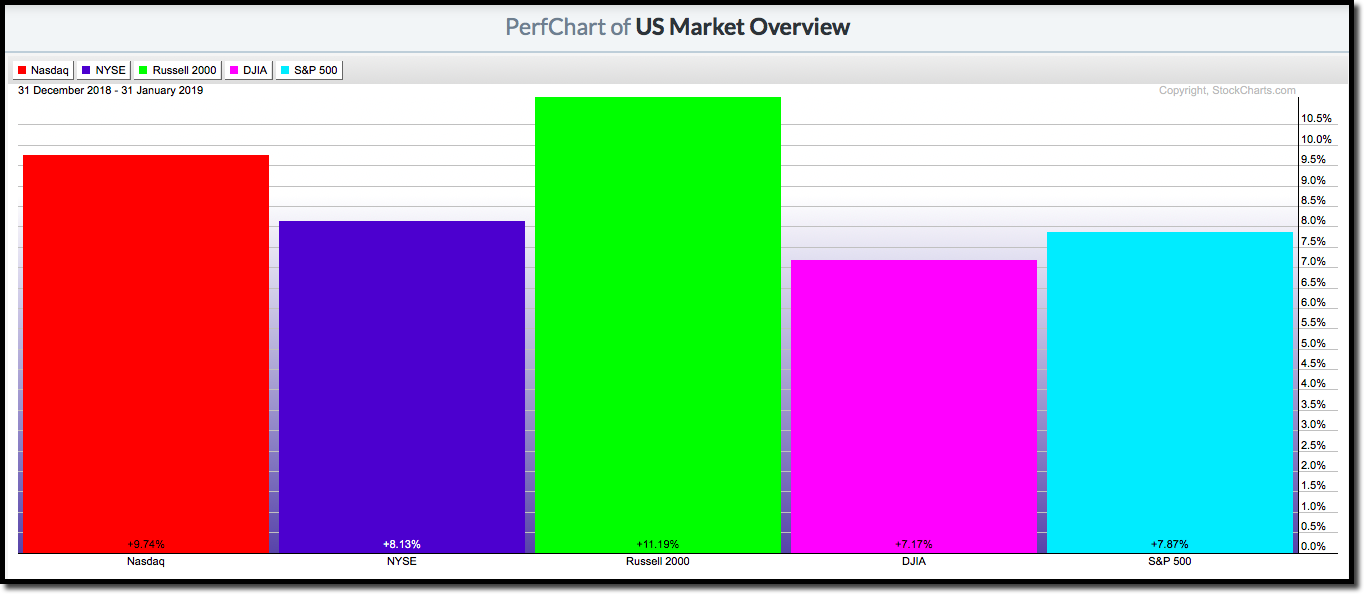
All the major markets are in recovery mode.
But the question is – is this just a bounce back rally after an extremely washed out, oversold market – or is there real staying power to this bull rally?
Well, one indicator that is worth following is the NYSE Positive Trend chart.
As a refresher, this indicator measures the percentage of stocks in the NYSE that are trading above the bullish support line or are in a positive trend.
As market technicians, we want to see at least 50% of the stocks trading on the NYSE in a positive trend. Anything over 50 is indicative of a healthy market usually offering up positive returns – more on that in a minute.
Check out this Positive Trend chart of the New York Stock Exchange (NYSE-PT):
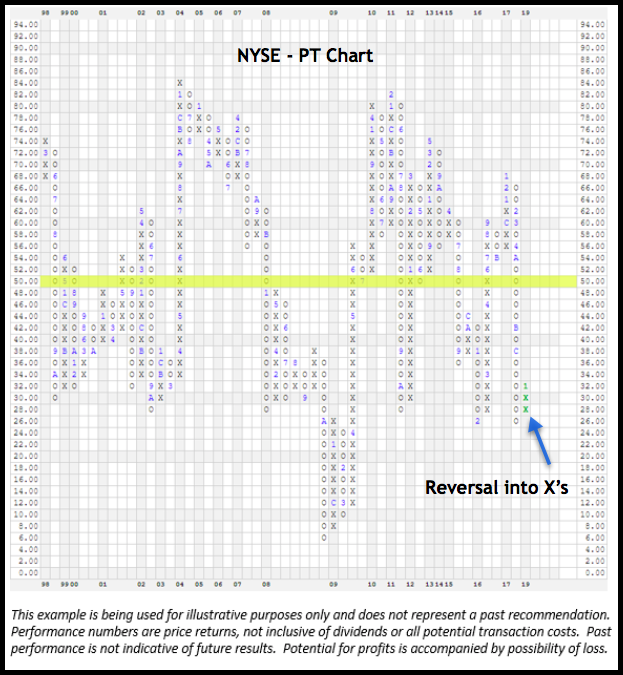
As you can see, the chart currently resides at 32%, indicating only 32% of all the stocks trading on the NYSE are in a positive trend – meaning this market still has some work to do before reaching the 50% level.
Typically, we see a majority of gains in the domestic equities space occur when this indicator is above 50%.
You can see the results below, in a study provided to us by Nasdaq/Dorsey Wright.
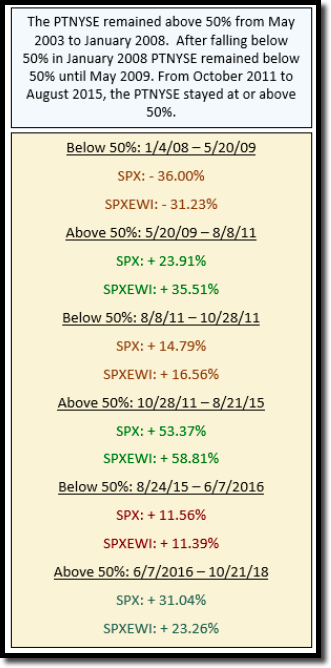
Based on historical performance, the odds favor positive performance when this chart gets above 50%. So it really is a powerful indicator and one you’ll want to check in on periodically.
Back to the chart… although the NYSE PT chart resides in low filled position, at just 32%, the reversal back into X’s should not be discounted.
The move to X’s indicates continued positive momentum as more and more stocks join the party and return to a positive trend. This can only happen if demand for stocks is strong and remains strong as momentum continues to build.
And consider this, the reversal up at 32% is the first time the indicator has been in a column of X’s since February of 2018, when it reversed down from a high of 68%.
We often say we draw conclusions based on the weight of the evidence.
The best way to do that is by reaching deep into your technical toolbox, pulling out each of your technical price tools, lining them up, and objectively drawing a conclusion.
The NYSE PT chart is just one more tool investors can rely on to help interpret the current condition of the market in front them – without all the noise and hype delivered by many financial media outlets.
Remember, most financial media outlets feast on investor emotion. Don’t be lunch. Focus on price – because price is really all that matters.
If you’re interested in learning more about the indicators we look at in order to technically evaluate the market, don’t hesitate to reach out to us by emailing info@rowewelath.com
We also offer free consultations to investors with portfolios of $500,000 or more. If you haven’t already evaluated the relative strength and risk present in your current portfolio, there’s never a better time.
Click here to see available call times.
Until next week, safe investing.

Get Our FREE Guide
How to Find the Best Advisor for You
Learn how to choose an advisor that has your best interests in mind. You'll also be subscribed to ADAPT, Avalon’s free newsletter with updates on our strongest performing investment models and market insights from a responsible money management perspective.
