
Related Blogs
December 14, 2020 | Michael Reilly
 This leading market indicator is giving you a second chance – don’t miss it!
Price, relative strength and momentum are what guide our process. Sprinkle in the importance of intermarket relationships and now we’ve got something.
This doesn’t have to be complicated or mysterious. Sometimes, perhaps often, simple and straightforward is the real key to success.
The question we’re looking to answer is – are stocks in an uptrend or a downtrend? Are we in a market that makes sense to be buyers of stocks, or sellers of stock?
And if not stocks, then what asset class is strongest relative to the alternatives?
Back in January and early February, there were signs of potential problems brewing for stocks. But it wasn’t stocks signaling potential problems – the signal was coming from bonds – specifically, bond yields.
Intermarket analysis is a valuable tool. Comparing the relationships of one asset class to another can provide useful and often profitable information.
In January, the commentary was all about record highs in the S&P 500 Index. The problem was – the journalist too many investors rely on for information, missed the boat and a very important signal that was sent by the bond market.
You see, when an asset class outperforms on an absolute basis – as stocks were in January, they should outperform on a relative basis as well.
So while the talking heads of your favorite financial news station couldn’t get enough of record highs in stocks, the bond market began quietly attracting a lot of money – so much money in fact, that bond prices rose sharply, causing bond yields to collapse. That was the “tell” that there were real problems in the stock market.
Stay with me and I’ll make sense of this. Here’s how it works, Bonds and interest rates (i.e. yield) have an inverse relationship. So if bond prices rise, yield falls. If bond prices fall, yields rise. And what causes prices rise or fall? Simple supply and demand.
The thinking in January was if 10yr Treasury yields collapsed and broke below their previous lows of 2016, it’s probably happening in an environment where stocks are under pressure – not in an environment where stocks are going to do well.
And that’s what happened – bond prices were rising and continued to rise- because of demand, that caused yields fell off a proverbial cliff. Stocks soon followed.
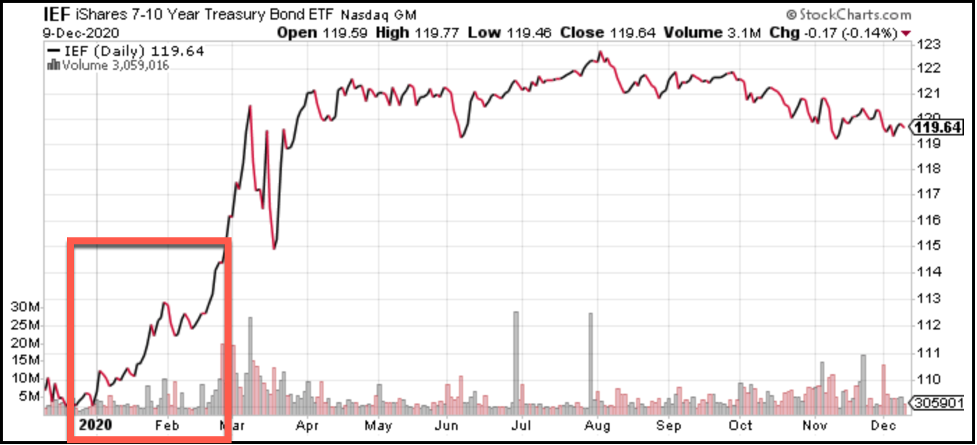
Below is the 7-10yr Treasury ETF (IEF). In January alone this Treasury Bond fund rose almost 3% (2.9%) and by February 28, 2020 it had jumped in by 5.96%.
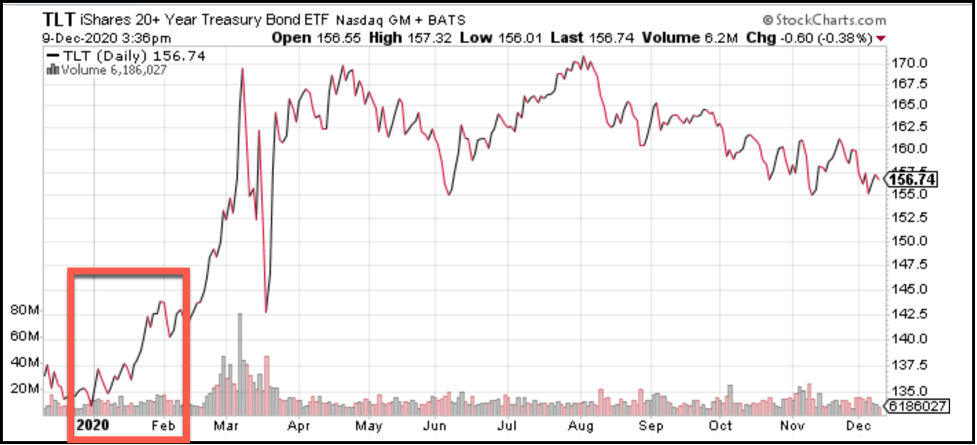
There were even bigger moves in the 20yr Treasury. Between January 3, 2020 and January 31, 2020 the price of the 20yr Treasury (using TLT) had risen 5.63% – By February 28, 2020, TLT had jumped by a staggering 12.62% in just two months!
That can’t happen unless there is a ton of money flowing into bonds creating demand. And if money is flowing into bonds it’s coming from somewhere, that somewhere was the stock market – but investors only looking at the index would never see it happening.
You can see what happened to yields as prices rose – they absolutely collapsed.
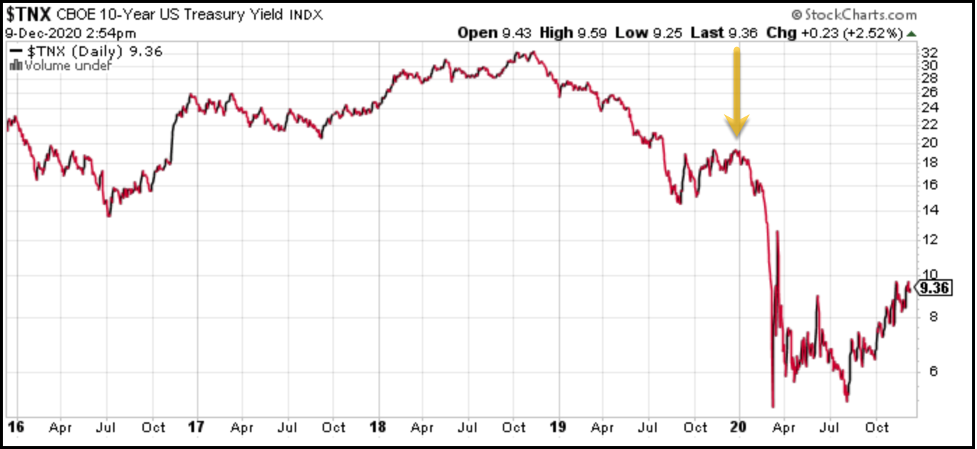
This was the “tell” – the signal that there were potential problems for stocks. Yields don’t so that in an environment that stocks are going to thrive.
Now these same yields are flashing a new potential signal.
Take a look at the same chart of 10yr Treasury yields. Feast your eyes on the box to the far right. Treasury yields are hitting a 9 month high!
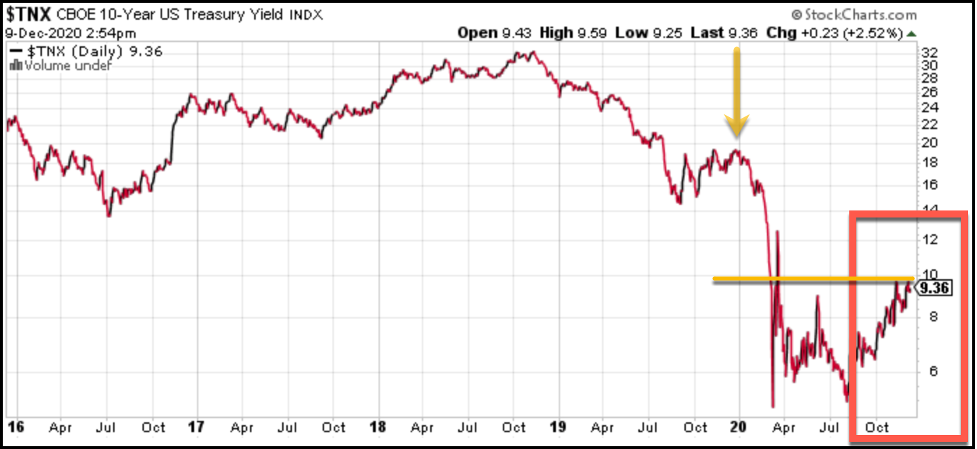
That only happens if bonds are selling off – money flowing out of bonds.
In January, money was flowing out of stocks and into bonds driving up bond prices and driving down yields.
This is not January! In fact, it looks like the opposite, today, we’re seeing lower bond prices and higher stock prices.
So here, the bond market is telling us something about the stocks.- these are important intermarket relationships (relative strength relationships) that we continue to monitor.
Will it continue? Will money continue to flow out of bonds and into stocks? Well, markets are fluid, this is what we see today, it’s always subject to change. I’ll be watching these key levels in yields and intermarket relationships over the coming weeks to help answer that question.
Check back again for more..
Until next week, invest wisely.
Tags

Get Our FREE Guide
How to Find the Best Advisor for You
Learn how to choose an advisor that has your best interests in mind. You'll also be subscribed to ADAPT, Avalon’s free newsletter with updates on our strongest performing investment models and market insights from a responsible money management perspective.
