
Related Blogs
April 26, 2021 | Michael Reilly
 Let’s get right to the point…
The analysis we do is about making heads or tails out of the inter-market relationships that exist between global asset classes. What stocks are doing relative to bonds or gold or what the currency markets are telling us about risk… We’re always weighing the evidence.
It is through this analysis that we can clearly see markets as they are – not as we may like them to be. It’s the reason we spend hours combing through price charts of every major asset class out there… Trying to identify risk and answer the age-old question – Should we be buyers of stocks or sellers.
It’s not about today’s headline or the hottest new stock trend – none of that matters. It’s just noise.
Do you know how much cross-market information we can gain from watching Bitcoin or Dogecoin? Ya, none. Seriously, the Crypto market just isn’t big enough to matter. It’s new, it’s cool and someday it will really matter.
However, if Crypto went to zero tomorrow, there would be no global market implications to consider. No information to glean from its demise.
And until there is, you won’t see me writing about it here. So let’s spend our energy addressing the kind of market relationships that investors can use to see markets more clearly.
Today, I want to share a ratio that has real market implications.
The bond market is the largest market in the world, so even if you never trade bonds, to overlook it seems a bit foolish. Because changes in this market have real-world global implications.
This kind of Inter-market analysis doesn’t just tell us about the Fixed Income market, it also provides a wealth of information regarding the level of risk appetite – or risk aversion, that investors are currently seeking in ALL markets.
Below is a ratio chart comparing TIPS – Treasury Inflation-Protected Securities, to straight-up Treasuries. Using ETFs as our bond proxies, the ratio chart looks like this:
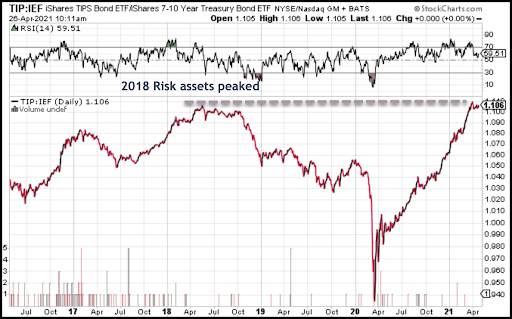
Here’s the deal, when this ratio is rising, it tells us that investors are anticipating higher inflation. So to hedge that future inflation risk, investors flock to investments like TIPS.
Now, the idea of higher inflation isn’t all bad – inflation comes as a result of a growing economy – that’s a good thing. But, investors do want a hedge – and they find it in places like TIPS (that adjust for inflation).
TIPS have made a near vertical move higher off of last year’s lows. It tore right through its pre-COVID peak and is now back to a key level at its 2018 highs as it tries to break out of a multi-year base.
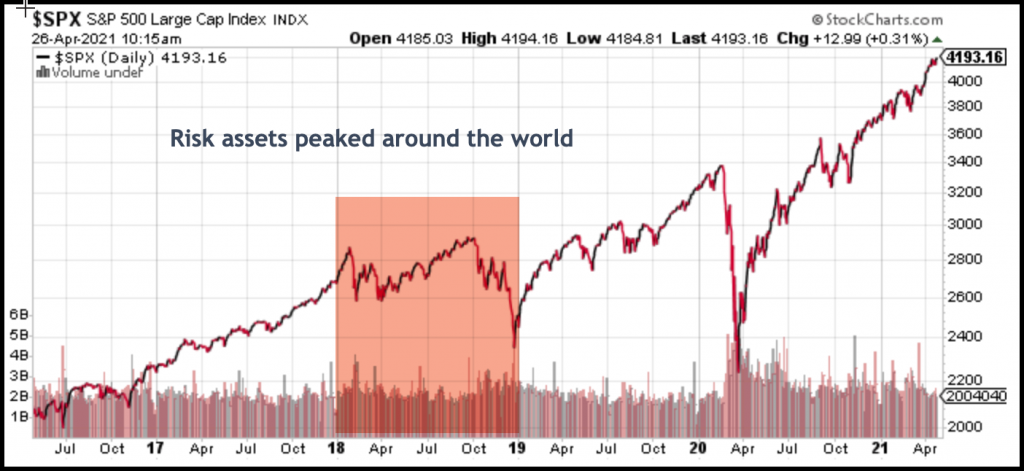
That 2018 level is important. Because 2018 is when global risk peaked – and when stocks began to sell off all over the world. This is just another reason why this current level is so important.
Right now, we are once again, back at this key 2018 level and we are seeing the signs of a failed breakout at this same key inflection point.
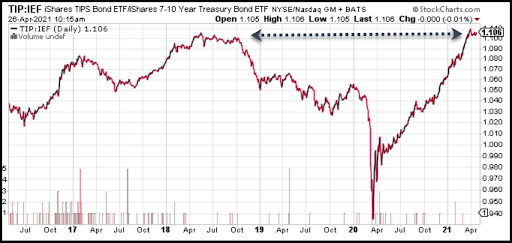
The question is, what effect will this have on other asset classes if the ratio is unable to break above its 2018 highs and instead, moves to the downside?
We probably would see lower rates, lower commodities prices, cyclical weakness, and maybe even a higher dollar…
Oh, and stocks are likely under pressure too.
We’ll continue to watch cross-asset ratios such as this one (TIP:IEF) for information regarding the health and future direction of global markets.
For now, the information we’re getting from the Bond Market is simply reaffirming what we’re already seeing from other asset classes… And that is that we remain in a trendless mess – the question is, for how long – a month? Maybe longer?
On a positive note, zooming out to the bigger picture, we remain bullish. Nothing about our structural outlook has changed. It’s in the short-term that markets look messy – as more and more data points (like the ratio above) are suggesting risk-assets remain range-bound.
These next moves in the credit market are likely to have significant implications across a wide variety of other asset classes so we’re paying close attention and will be sure to follow up once these charts resolve!
Until next week…
Tags

Get Our FREE Guide
How to Find the Best Advisor for You
Learn how to choose an advisor that has your best interests in mind. You'll also be subscribed to ADAPT, Avalon’s free newsletter with updates on our strongest performing investment models and market insights from a responsible money management perspective.
