
Related Blogs
February 29, 2024 | Avalon Team
Despite last week’s impressive gain by NVIDIA stock, the Nasdaq has posted five losses in the past seven trading days.
Certainly, a pause or a pullback could be warranted given the sharp rise since the late October 2023 lows.
However, despite the current market rally, the market internals remain less than impressive. Market breadth has remained very narrow with a diminishing number of companies pulling the major averages higher.
What investors may not realize is that just four companies have accounted for 90% of the gains in the Nasdaq 100 this year.
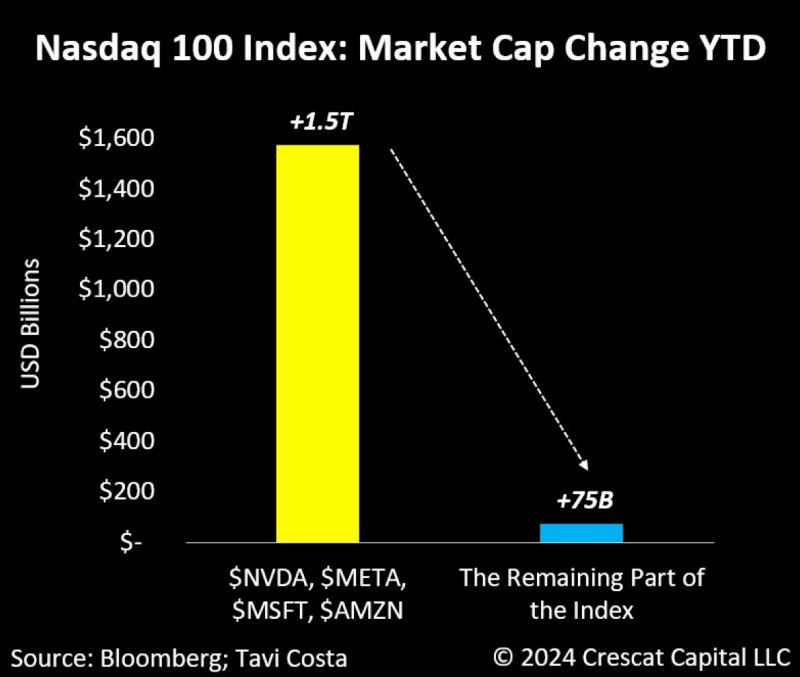
Missing from this group are stocks such as AAPL and GOOG which have started to diverge from the index trend.
Since July 2023, Apple has been underperforming the QQQ’s by close to 22% and Google has been underperforming by 19% since October…
On a YTD basis:
TSLA -19%
AAPL – 6%
GOOG -2%
QQQ + 7%
Point and Figure analysis of the bullish percent charts for the S&P 500, the Nasdaq, and the S&P 600 Smallcap Index all tell the same story – supply is winning as each is now in a column of O’s.
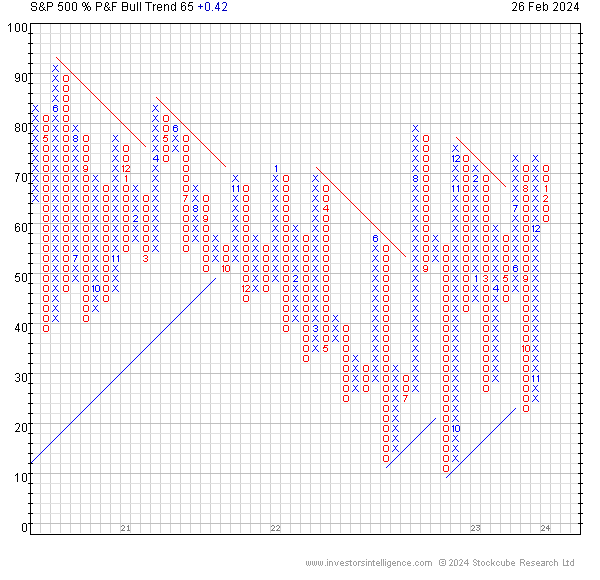
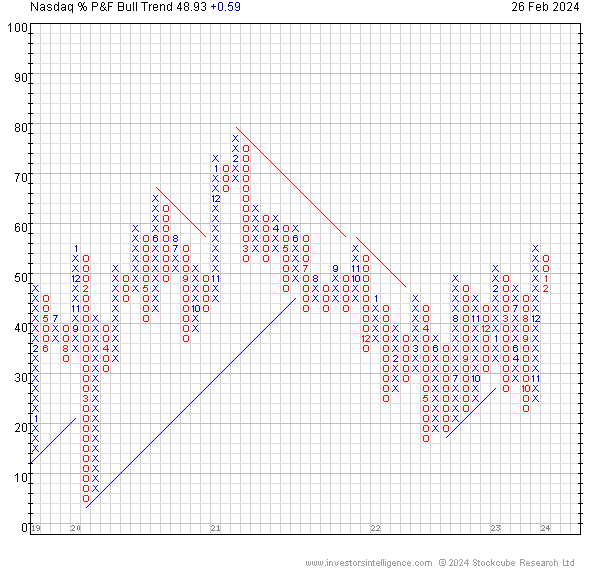
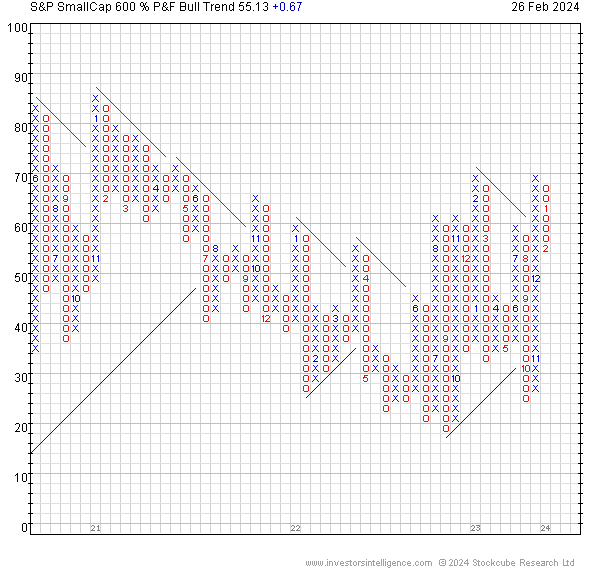
These charts suggest that the market could be in the early stages of shifting to a period of “risk off.”
Among the core U.S. asset classes, there remains a sizeable performance differential between U.S. large caps and U.S. small caps.

Outside of the U.S., Japan is leading the path higher recently reaching a level last seen in December 1989.

The Nikkei 225 stock average set an all-time closing high for the first time in 34 years and two months, breaking the previous record of 38,915.87 set on Dec. 29, 1989.
Meanwhile, the U.S. Dow Jones Industrial Average has risen nearly 14-fold from 2,753 at the end of 1989 and the tech-focused Nasdaq Composite has increased about 35-fold over the same period.
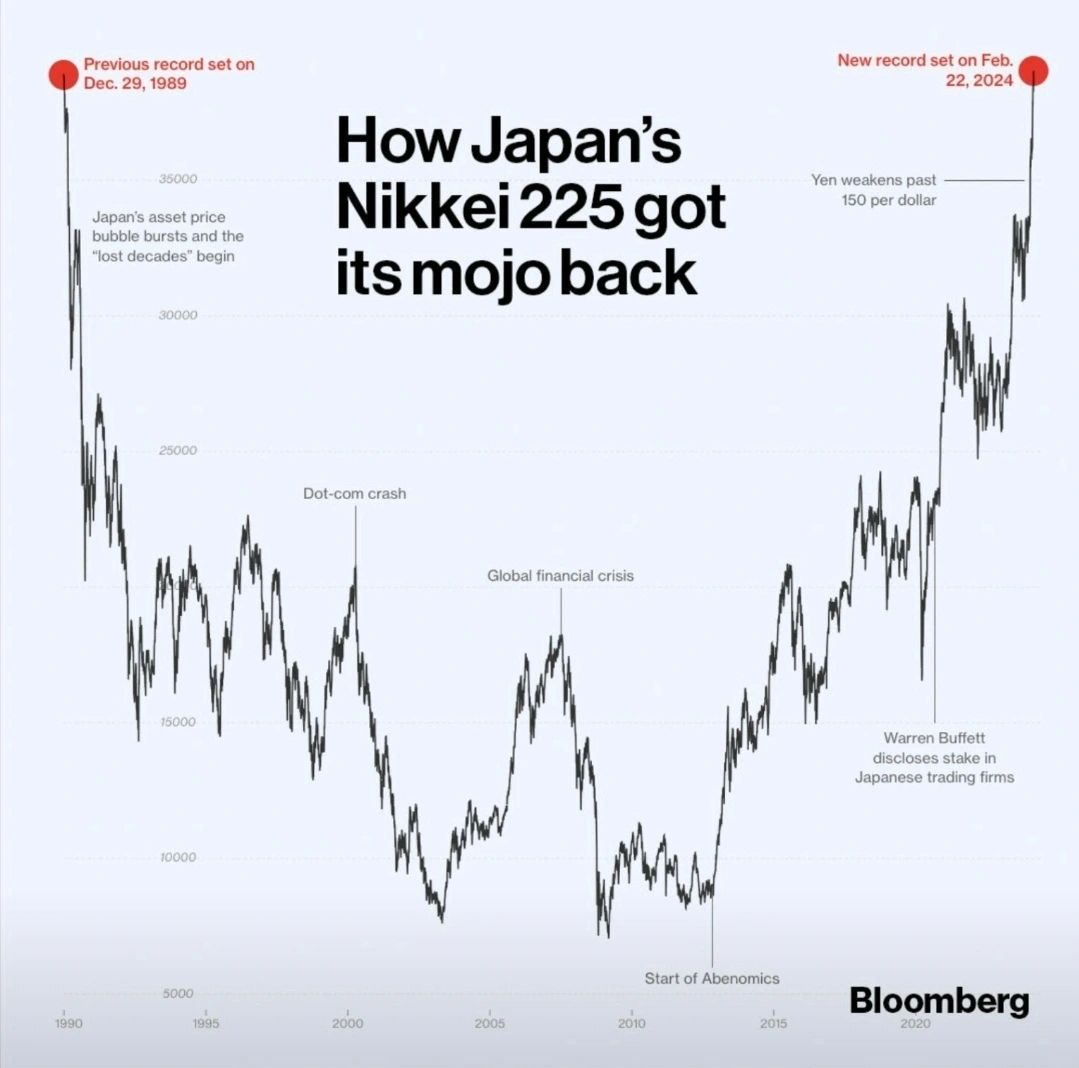
If there is ever a modern chart that screams the need to manage risk… this is it.
A common argument by passive investors is that “the market always comes back.”
While I applaud the optimism, managing a portfolio by assuming the market will come back is like putting all of your chips on black in a game of roulette.
It’s simply a terrible way to manage risk.
Buying and holding to wait 34 years to get back to even is not acceptable on any level… and this doesn’t even tell the story of the companies that did not survive along the way.
Risk management should always be THE TOP PRIORITY of investors.
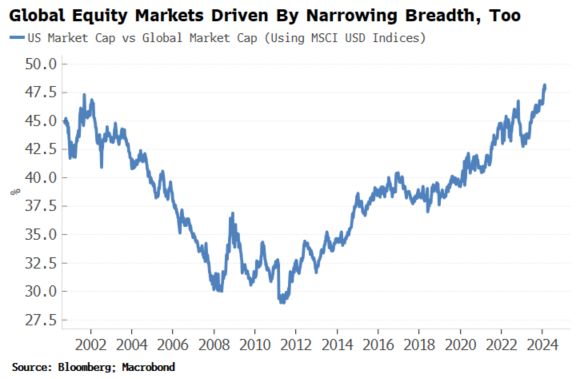
It’s not just breadth in the U.S. market that is becoming ever narrower, as global equities are also being driven by the U.S.
Global equities indexes and global ETFs such as the iShares Global 100 (IOO) are dominated by Microsoft, Apple, NVIDIA, Amazon, Google, etc.
The U.S.’s market cap is now 48% of the global market cap, its highest since the early 1970s.
Back then, the U.S. was more than 60% of global stocks – this was at the time of the now infamous Nifty Fifty darlings of the equity market that everybody owned.
The chart below vividly shows the pronounced overvaluation of U.S. equities versus the rest of the world.
It’s important to emphasize that price-to-book is just one metric for comparison; others, like Buffett’s total market cap of stocks to GDP and Shiller’s CAPE ratio, also reveal similar historical disparities worldwide.
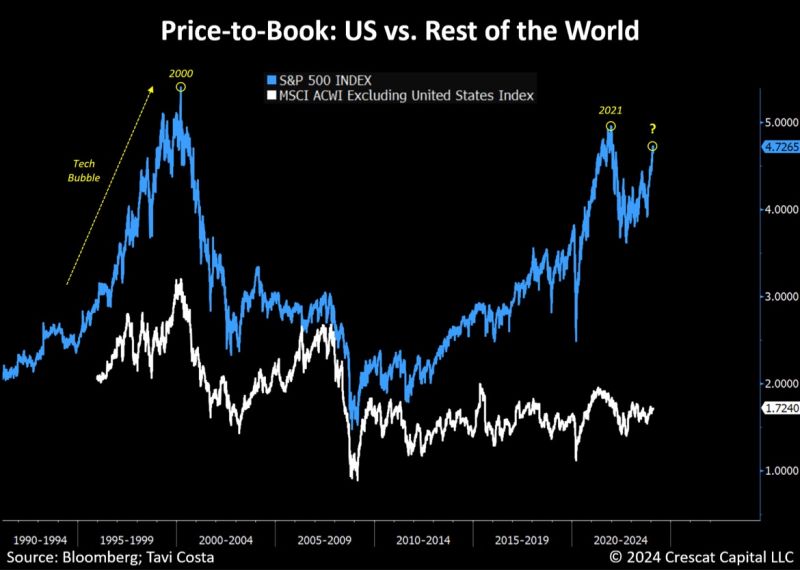
Notice that the rest of the world is currently as cheap as the U.S. market was at the very bottom of the global financial crisis.
This prolonged underperformance is the result of several factors, including the dominance of American technology companies in the sector, chronic underinvestment in commodity-led economies and resource businesses, China’s debt crisis, and various other factors.
For investors attempting to diversify with bonds, so far 2024 is again proving to be a challenging year as bonds have returned moderate losses across most durations.
Short-term bonds, T-bills, and money markets continue to provide investors with the best returns YTD.

For investors seeking improved diversification beyond traditional stock-bond allocations, global trend-following strategies are my “go-to” as they can benefit from both rising and falling markets and add exposure to such things as currencies, commodities, energy, global bonds, and metals.

The above graph shows the improved performance of a 60/40 portfolio that includes an allocation to a global trend following strategy.
The portfolio displays improved Compound Annual Growth, lower drawdowns, and a much higher risk-adjusted return.
As always, before making any changes to your investment portfolio, we recommend you speak with your professional advisor first.
If you’ve been considering hiring an advisor to help guide you through the ever-changing financial landscape, take your first step today by scheduling a free consultation with one of our experienced team members. There’s no risk in exploring if we’re the right fit for your financial goals. Contact us now.
If you have any questions or have been considering hiring an advisor, then schedule a free consultation with one of our advisors today. There’s no risk or obligation—let's just talk.
Tags

Free Guide: How to Find the Best Advisor for You
Get our absolutely free guide that covers different types of advisory services you'll encounter, differences between RIAs and broker-dealers, questions you’ll want to ask when interviewing advisors, and data any good financial advisor should know about you and your portfolio.
