
Related Blogs
February 15, 2019 | Michael Reilly
After a slightly disappointing Thursday, markets jumped higher Friday as good news began to emerge from the white house. For the week, the Dow, Nasdaq, and S&P are all set to gain at least 2%.
At this point, the Bear vs. Bull tug of war we talked about last week has more or less ended, with the bulls taking the reins…for now.
As always, market sentiment is driving these movements, and optimism is currently high. This is largely due to the good news coming out of DC. The fear of another impending shutdown has died out, with the president agreeing to sign the spending bill that passed votes in the house and senate.
To top it off, the U.S.-China “trade war” is finally showing some signs of resolution. Trade talks wrapped up early on Friday, and negotiators are scheduled to continue discussion next week in Washington. Although they still remain deadlocked on some issues, it appears they are set to resolve these before the March deadline.
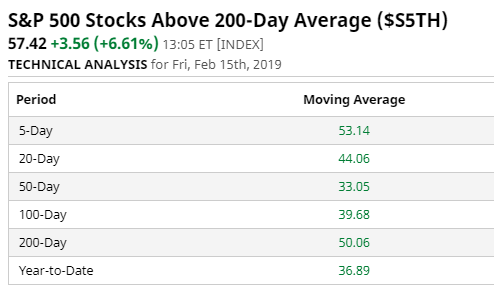
As you can see in the chart above (from www.barchart.com), 50.06% of stocks on the S&P are trading above their 200-day moving average, which is generally seen as a good indicator that the market in general, is healthy.
Stocks trading above their 200-day moving average are typically enjoying long term bullish momentum, and this is the first time since October 2018 that this indicator has passed 50%. As recently as December 2018 this indicator had dropped to less than 10%, so you can probably appreciate how big of a turnaround the past few months have given us.
Another positive sign we have seen for broad equities was the reversal up into X’s on the Percent of Positive Trend for All Equity Funds or PTMUO indicator.
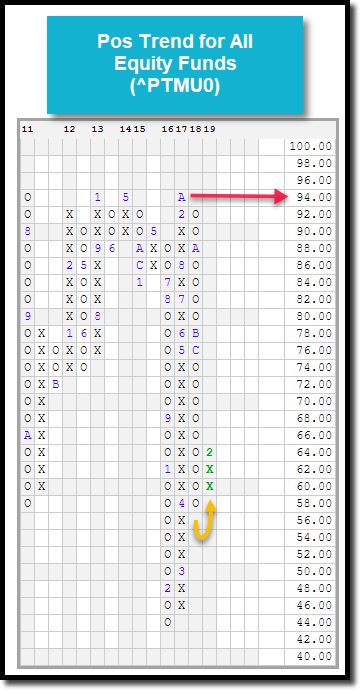
For many of you, this may be an unfamiliar chart. This chart -shared with us by Nasdaq/DorseyWright, measures the percentage of all equity related ETFs and Mutual Funds that are trading above their bullish support line, or are in a positive trend on their short term charts.
We witnessed this indicator reverse down into a column of O’s in October of 2018, falling from multi-year highs at 94% – indicated by red arrow. The reading continued to fall before ultimately bottoming out at 58% in December.
This past Wednesday’s market action was strong enough to cause a reversal of the chart – moving it up and into a new column X’s at 64%. This means 64% of all equity related mutual funds and ETFs are now in a positive trend.
The nature of this indicator leads to column changes being rare, meaning we should pay attention to them when they occur. In looking at the PTMU0, reversals back up into X’s after large drawdowns – similar to what we experienced in 2011 and 2016 and now, most recently in late Q4 2018, have typically led to strong uptrends in the following months – of course, there’s no guarantee history will repeat itself, but it is an important observation that adds to the overall weight of the evidence to be used in conjunction with other indicators as you draw conclusions as to the markets overall health and direction.
With so much optimism in the markets, it’s an important time to ensure your accounts are structured to take advantage of any potential gains. At Rowe Wealth, we ensure our clients’ accounts are holding stocks with high relative strength, which studies have shown can significantly increase your chances of outperforming the market.
If you haven’t had your holdings evaluated for their overall “strength”, this is a great time to do so. Feel free to click here to see our available call times for the upcoming week.
As always, invest wisely.
Tags

Get Our FREE Guide
How to Find the Best Advisor for You
Learn how to choose an advisor that has your best interests in mind. You'll also be subscribed to ADAPT, Avalon’s free newsletter with updates on our strongest performing investment models and market insights from a responsible money management perspective.
