
Related Blogs
February 26, 2020 | Michael Reilly

The big run-up in stock prices enjoyed late last year caused the market to become seriously overbought on a technical basis.
The market was looking for a reason to pull-back and it found one in fears over the Coronavirus.
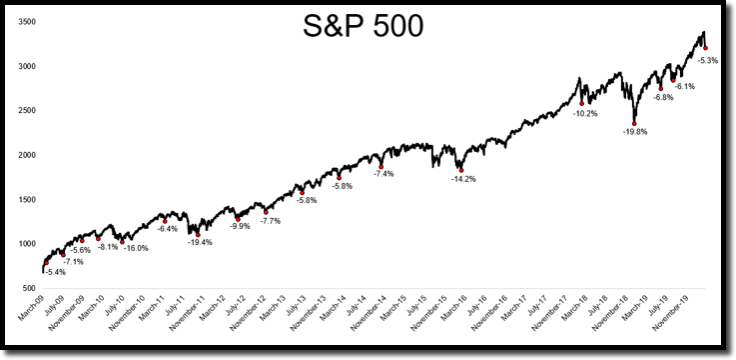
For the 18th time since the stock market bottomed in 2009, the S&P 500 is more than 5% off its high.
 Courtesy of The Irrelevant Investor
Pullbacks in the stock market are normal – even pullbacks in the indexes of 5%-10%.
As I commented in my previous writing, it seems like every time the market experiences any kind of pullback, it invites fear… and headlines in big red text don’t help – “Noise” as we refer to it. It’s everywhere on social media, TV, blogs, and the radio.
Without the alarming headlines, most investors would agree pullbacks are normal and nothing to panic about.
But I don’t think most investors are really worried about a 5%-10% pullback in stock prices.
No doubt, this is a bad week for stocks. The DJIA has moved from record highs to correction territory in a matter of days. And that’s got investors rattled.
And as you can see here, all 11 broad sectors are off their recent 52 week highs.
I took this screen shot at 9:45am this morning (02/27/2020).
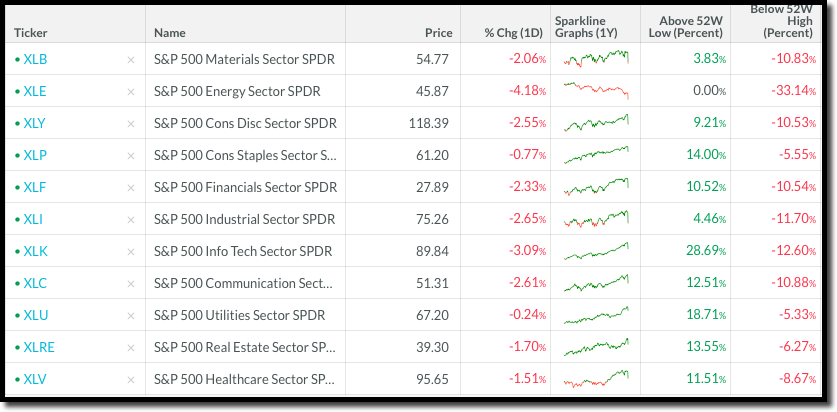
Some sectors, like Energy are getting crushed, off 33% from their 52 week highs, while other sectors – Utilities, Consumer Staples and Real Estate (all defensive sectors) are holding up pretty well. Most are off their respective 52 week highs around 10%.
A 10% drawdown is pretty normal, albeit stressful. So we can’t raise the white flag just yet. But, we can’t say everything will be ok either.
And that’s the real concern. Investors are worried about what this might turn into – not what it is today..
It’s the “What-if Syndrome”. What if the virus continues to spread, what if it brings the global economy to a grinding halt, and what if the stock market crashes?
This is what investors are really worried about.
So, what are the odds of the stock market crashing?
Well, without the proverbial crystal ball it’s impossible to know what the future holds. There are far too many variables to consider.
Here’s what I can tell you –
Over the last hundred years, investors have experienced eight deep drawdowns, as you can see in the chart below.
 Courtesy of The Irrelevant Investor
Taking a look post WWII market data 1946 to today, we have been in a 20% or deeper drawdown on 14.13% of all days, and a 30% or deeper drawdown on 2.79% of all days.
So as you can see, big, meaningful stock market declines don’t happen very often. The concern is that when they do – they hurt!
The crash of 1929 wiped out 30 years of gains. The stock market crash of 1973-1974 took the Dow back to where it was in 1958.
And at the lows in 2009, the market was trading around prices seen in 1996!
So is 2020 the year of the next big market crash?
Unfortunately nobody knows the answer to that.
There are no rules for how these things play out, if there were everybody would follow them.
We’ve been through pandemics in the past – and yes, before you mumble the words “this time is different.” Every pandemic has been “different” and “scarier than the last.”
We’ve experienced three major pandemic scares over the last 20 years. SARS, H1N1 (Swine Flu) and Ebola.
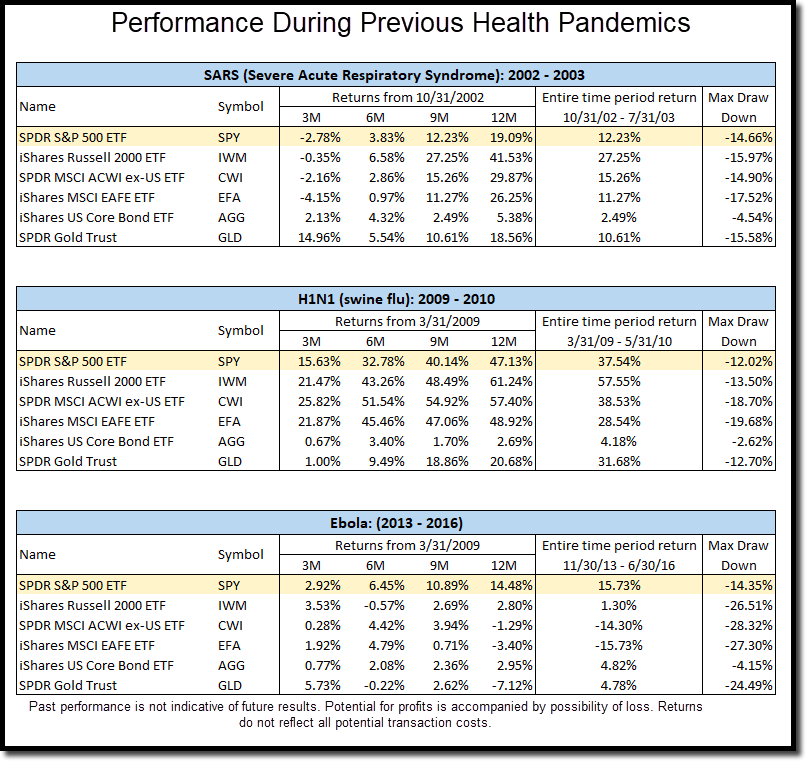 Chart courtesy of Nasdaq/Dorsey Wright
With each outbreak markets outside the U.S. were hit hardest, while the S&P 500 experienced draw-downs of 12%-14%. Those are not bear markets, even if it feels like it in the short term.
Sure, it’s possible, if not likely that the U.S. will experience an increase in Coronavirus cases. And fear and panic could drive the market lower.
The good news is that investors who are worried about deep market declines, and that would be virtually everybody reading this, can take actions to make sure they can survive the big one.
We can’t control when the next market crash is going to come, but we can make sure that we’re properly positioned for it.
This may sound obvious, but risk is directly tied to reward, the more stock market volatility you can handle, the higher returns you’re going to receive.
The more you risk, the more you make, and the more you make, the more you have to be willing to lose.
There is an amount of pain that you must be willing to bear per unit of risk.
The most important thing for investors is to have their risk tolerance properly calibrated.
If you are feeling extremely nervous after the last two days, you’re probably taking too much risk. If you weren’t feeling anything, you can probably afford to take more of it.
Even though the likelihood of a stock market crash is low, they happen, so it’s perfectly rational to think that you might get caught up in the storm. If anything, it’s irrational to think otherwise. So plan accordingly.
Here at RWM, the way we plan for the possibility of a large market crash is through a rules based investment process. Our process is unemotional and designed to keep investment capital pointed in the direction of the strongest asset classes and while avoiding the weakest.
The last big market decline was in 2008-2009. Sure, we’ve had a few corrections since then, but nothing that compares to the magnitude of 2008. Ask anyone who’s been investing for any length of time – they’ll remember how painful the Great Recession was and most have vowed to never let it happen again.
So how can you avoid the next big market downturn?
Well, one way is to implement a rules based investment process. For example, RWM’s rules require that we invest primarily in only the top one or two strongest asset classes, while limiting exposure to the others.
Looking back, this rules based process would have had your investment dollars out of U.S. equities in November 2007, thus avoiding the nearly 40% collapse in the S&P 500.
Below are the current Asset Class rankings.
U.S. equities are ranked #1, according to the algorithms, while Commodities rank #5 and Currencies last at #6

Here are the Asset Class rankings in 2007.

International equities were ranked #1, with Domestic equities Ranked #2 on November 9, 2007.
However, on November 12, 2007, U.S. equities fell to the #3 ranked asset class. And in doing so, would have resulted in U.S. equities being removed or drastically reduced in investment models similar to ours.
And that’s one of the strengths of a relative strength, rules based investment process. It has the ability to keep your investment dollars pointed to the asset classes seeing the most demand while reducing exposure to asset classes experiencing supply in control.
Keeping informed of Relative Strength sector rankings can completely change the way you invest, for the better. Remember, sector relative strength rankings are listed in every issue of ADAPT, so make sure you’re scrolling to the bottom to see them.
If keeping up with all these changing conditions is too difficult, or sounds like more work than you’re willing to take on, you should consider seeking out the assistance of a qualified financial advisor to manage your portfolio for you.
If your portfolio is valued at least $500,000 you’re eligible for a completely free consultation from an advisor at Rowe Wealth. This will allow you to quickly pinpoint any discrepancies between your level of comfortable risk and the risk carried by the holdings in your portfolio, as well as any securities you own that are showing poor relative strength.
Click here now to schedule an appointment.
And, as always, invest wisely.

Get Our FREE Guide
How to Find the Best Advisor for You
Learn how to choose an advisor that has your best interests in mind. You'll also be subscribed to ADAPT, Avalon’s free newsletter with updates on our strongest performing investment models and market insights from a responsible money management perspective.
