
Related Blogs
January 24, 2023 | Chris Rowe
On Monday, the S&P 500 index closed above the 200-day moving average.
This kind of news always gets a lot of attention from investors… but is it justified?
The 200-day moving average is a commonly used technical indicator in stock market analysis used to smooth out fluctuations in stock prices over a certain period. It helps identify long-term trends.
If a stock’s price is above its 200-day moving average, it is generally considered to be in an uptrend. If it’s below, it’s considered to be in a downtrend.
Some traders use the 200-day moving average as a key indicator for determining whether to buy or sell a stock.
Here is the S&P 500 index as of Monday’s close.

Does this mean investors should jump into the market now?
Using data going back to 1999, yesterday’s close is the 86th time that the price close above the 200-day moving average after trading below it previously.
For investors who immediately jumped into the market, it may come as a disappointment to learn that only 19 trades (22.1%) were profitable with a mean gain of 7.59% vs. a mean loss of -1.22% on the 77.9% of trades that lost money.
Now, for investors who waited until the end of the month and only bought if the price remained above the 200-day moving average on the last trading day of the month, the results are better.
First, it reduces the number of trades to only 14 trades vs. the previous 86 trades.
Second, the percentage of profitable trades is 50% vs 22.1%.
But still, it’s only 50%.
Waiting for month-end confirmation really pays off when the median gain increases to 38.21% – a five-fold improvement. So fewer trades with bigger gains.
While the median loss size also increases to -5.76%, the increase in the percentage of wins and the median win size makes this the better choice.
To summarize these results, immediately jumping into the market has an expected gain of 0.72% vs. an expected gain of 16.3% for the investor who patiently waits until month end for confirmation.
The 200-day moving average is just one of many indicators used by traders and investors, and should not be relied upon solely when making investment decisions.
But maybe there’s an even better use of the 200-day moving average…
This chart reflects the percentage of stocks trading above their respective 200-day moving averages.
Over the past year, the market has made an important bottom when this level reaches less than 20%, indicating a very washed-out condition where most stocks have seen selling pressure.
Looking back over the past twenty years, we can see that this has only occurred 5 times and each time lead to a market rally.
That’s 100% of the time.
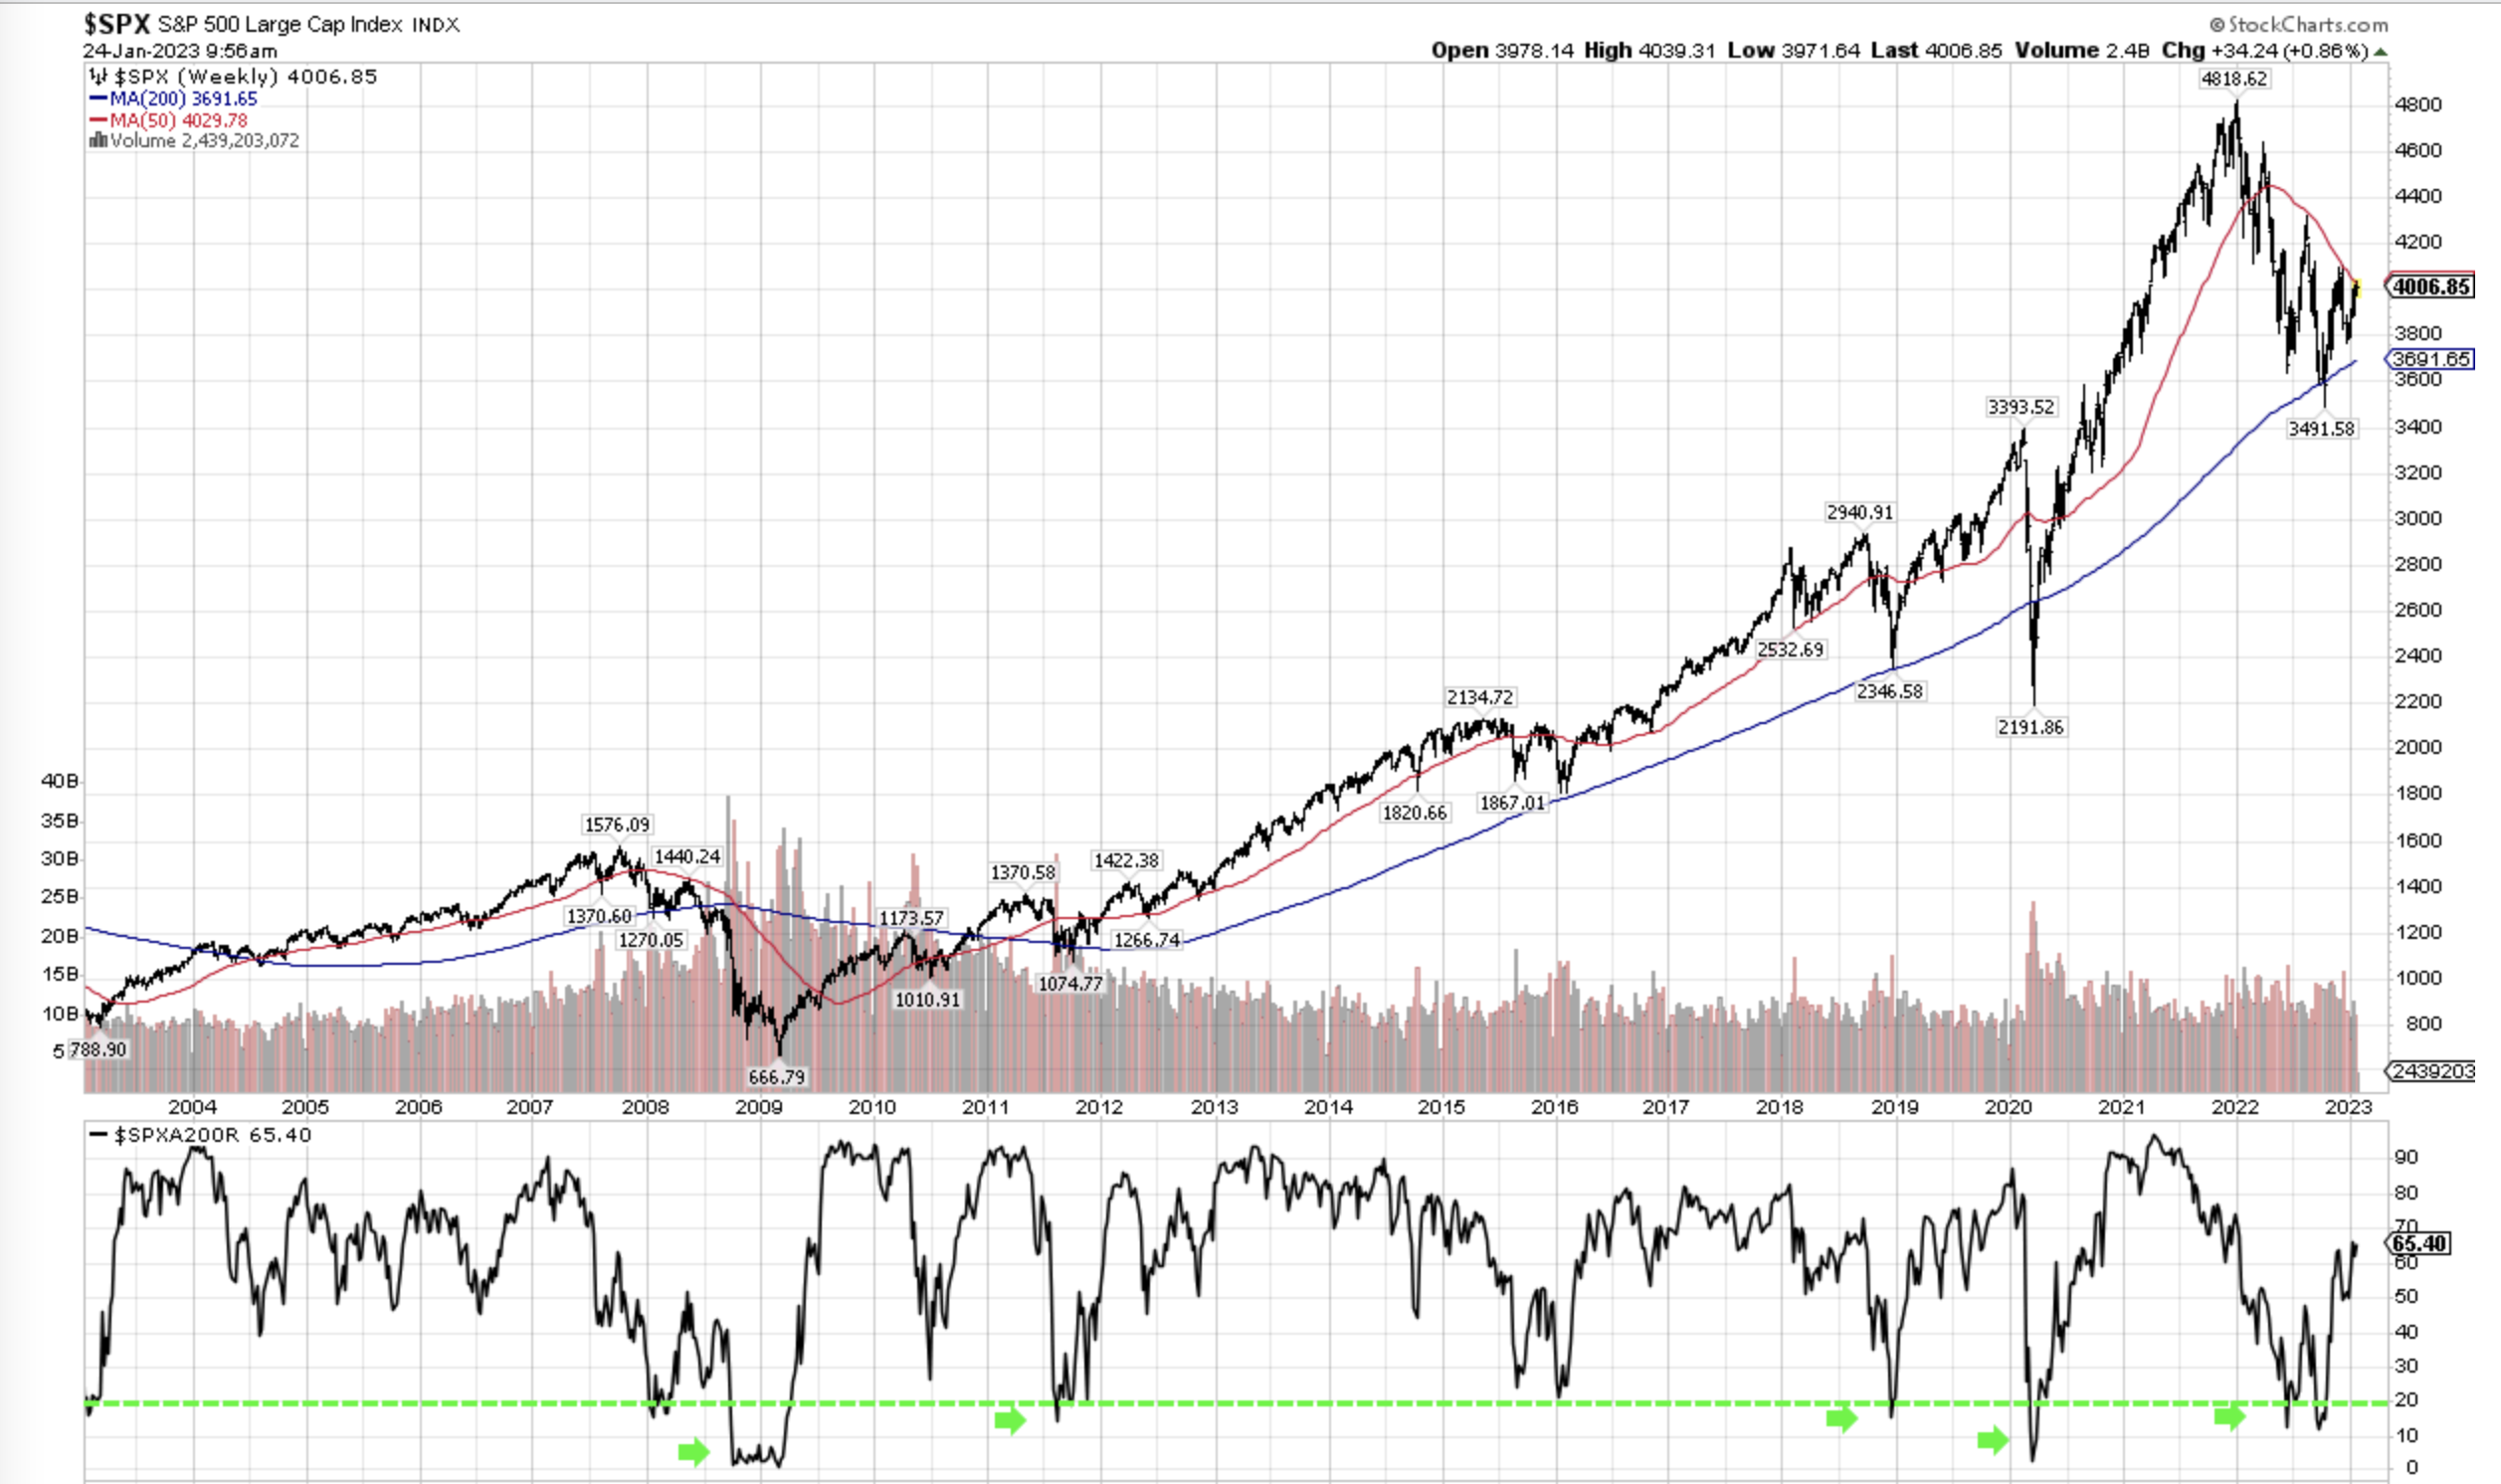
Studying the percentage of stocks above the 200-day moving average is the internal strength of the market – it’s very difficult for the broad market to perform well if less than 50% of the market participants are struggling to stay above their 200-day moving average.
With a current reading of 68%, investors can get some comfort that the current health of the present trend is good.
So while moving average crossovers may make the financial news, my money is on the more obscure information obtained from looking at the percentage of stocks above the 200-day moving average.
If you have any questions or have been considering hiring an advisor, then schedule a free consultation with one of our advisors today. There’s no risk or obligation—let's just talk.
Tags

Free Guide: How to Find the Best Advisor for You
Get our absolutely free guide that covers different types of advisory services you'll encounter, differences between RIAs and broker-dealers, questions you’ll want to ask when interviewing advisors, and data any good financial advisor should know about you and your portfolio.
