
Related Blogs
July 6, 2023 | Avalon Team
Charles Dow is considered the father of technical analysis and the creator of the original Dow Jones Industrial Average (DJIA).
And although his investment tenants have been around for nearly a century, they still remain valid, even in today’s technology-driven markets.
At a high level, Dow Theory describes market trends and how they typically behave.
At a more granular level, it provides signals that can be used to identify and subsequently trade with the primary market trend.
And that makes them as important today as they were 100 years ago.
Dow stressed that in order for a buy or sell signal to be valid, both the Industrial Average and the Transportation Average must confirm each other. If one average records a new high or new low, then the other must soon follow in order for a Dow Theory signal to be considered valid.
In an expanding economy, the price of industrial-related stocks should rise. A hundred years ago this expansion could be seen in the Dow Jones Industrial Average… and it’s still true today.
In a contracting economy (think recession) the price of industrial-related stocks and the stocks that comprise the DJIA will likely decline.
According to Dow, the DJIA and the DJTA act as a barometer of economic activity, indicating expansion or contraction, so they can be relied on for trend identification and confirmation.
Dow believed it wasn’t enough that goods were produced, they had to be sent off to market, so tracking Transportation stocks were also important to investor analysis.
Makes sense – goods accumulating in inventory does not equal growth.
And Transport stocks are much more dependent on the economic environment than the average stock and are more likely to foreshadow economic growth or decline.
There’s no doubt that today’s economy is very different than it was back in Dow’s day. The makeup of the DJTA has changed, favoring airlines over rails.
However, there is credibility in using the DJTA to confirm movements in the DJIA. Instead of rails, goods are often delivered via FedEx or UPS.
So how does all that help us today?
Well, for one thing, 2023 is a very different market than 2022.
Read it in the charts…
After last year’s downtrend in Industrials that was confirmed by a similar downtrend in Transports, both averages bottomed in September/October of 2022 and have reversed.
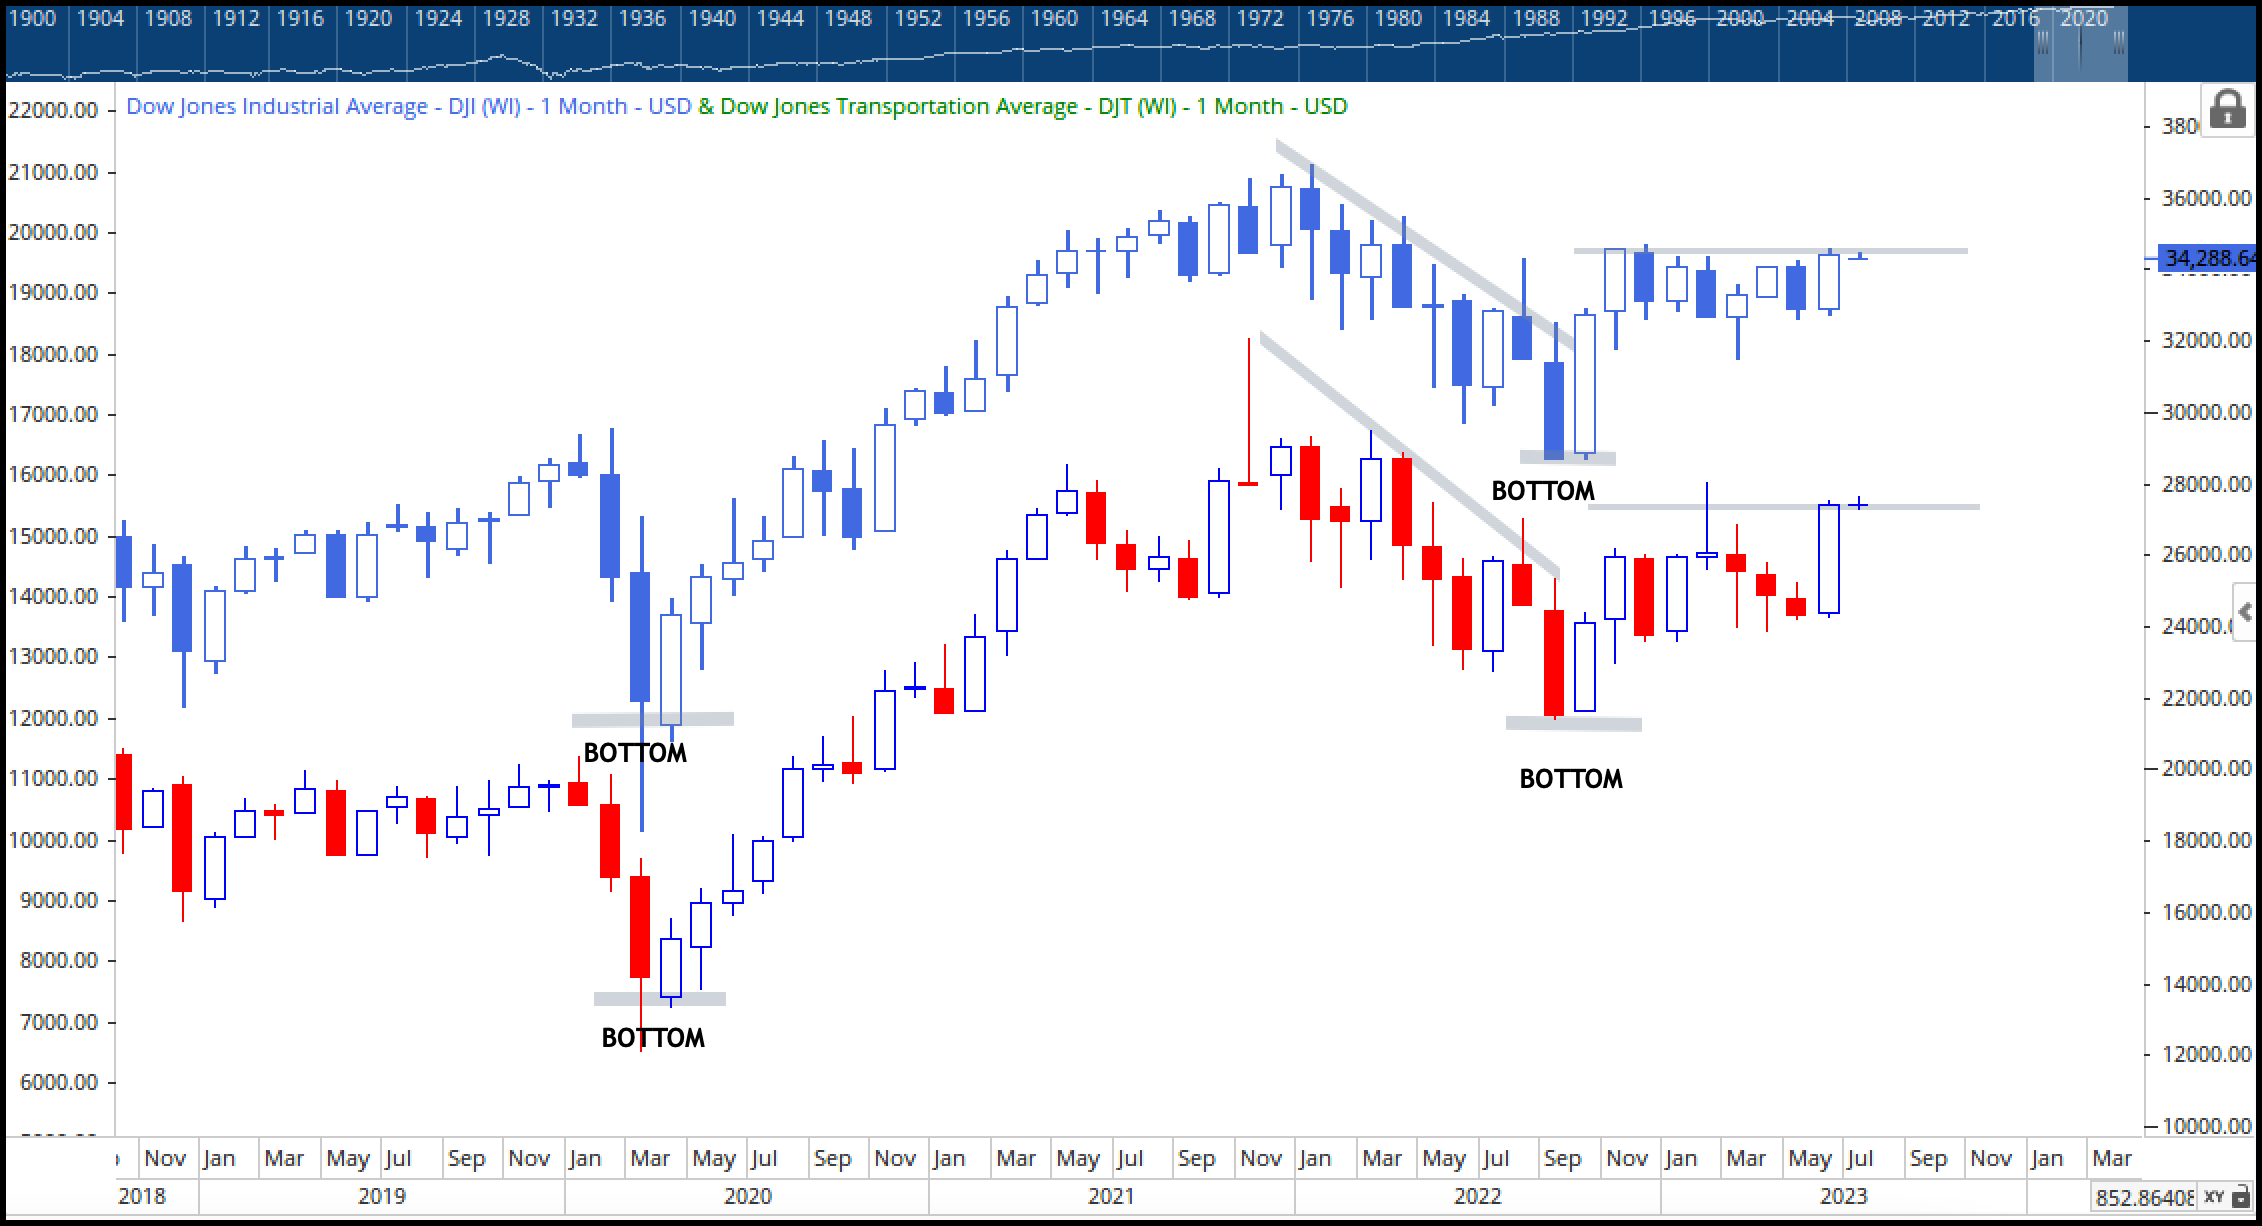
Following the October lows Industrials have continued higher and now sit at their highest levels in 10 months. The move higher in Industrials has been confirmed by Transports, giving a classic Dow Theory buy signal.
But wait, there’s more…
Not only have the DJIA and the DJTA moved to their highest levels in 10 months, further evidence of market strength can be seen in the price charts.
Here’s the SPDR Industrial Sector ETF (XLI). XLI is the most diverse sector of the S&P 500 and the sector most correlated with the S&P.
This sector has over 70 components – everything from waste management to airline stocks. And no one component makes up more than a 5% weighting of XLI.
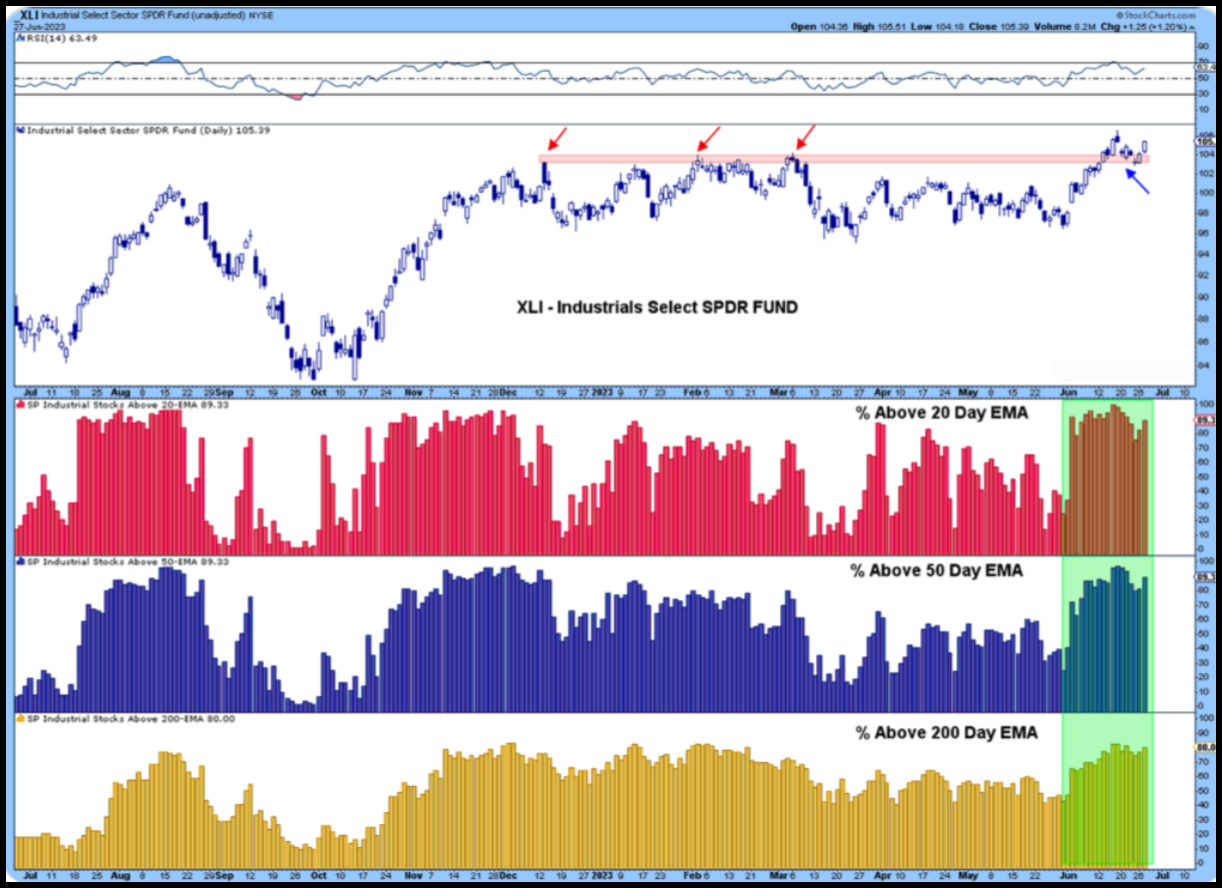
Take a look at the percentage of stocks above their 20-day, 50-day, and 200-day moving averages – a lot of industrial-related stocks are participating in the rise of this sector fund.
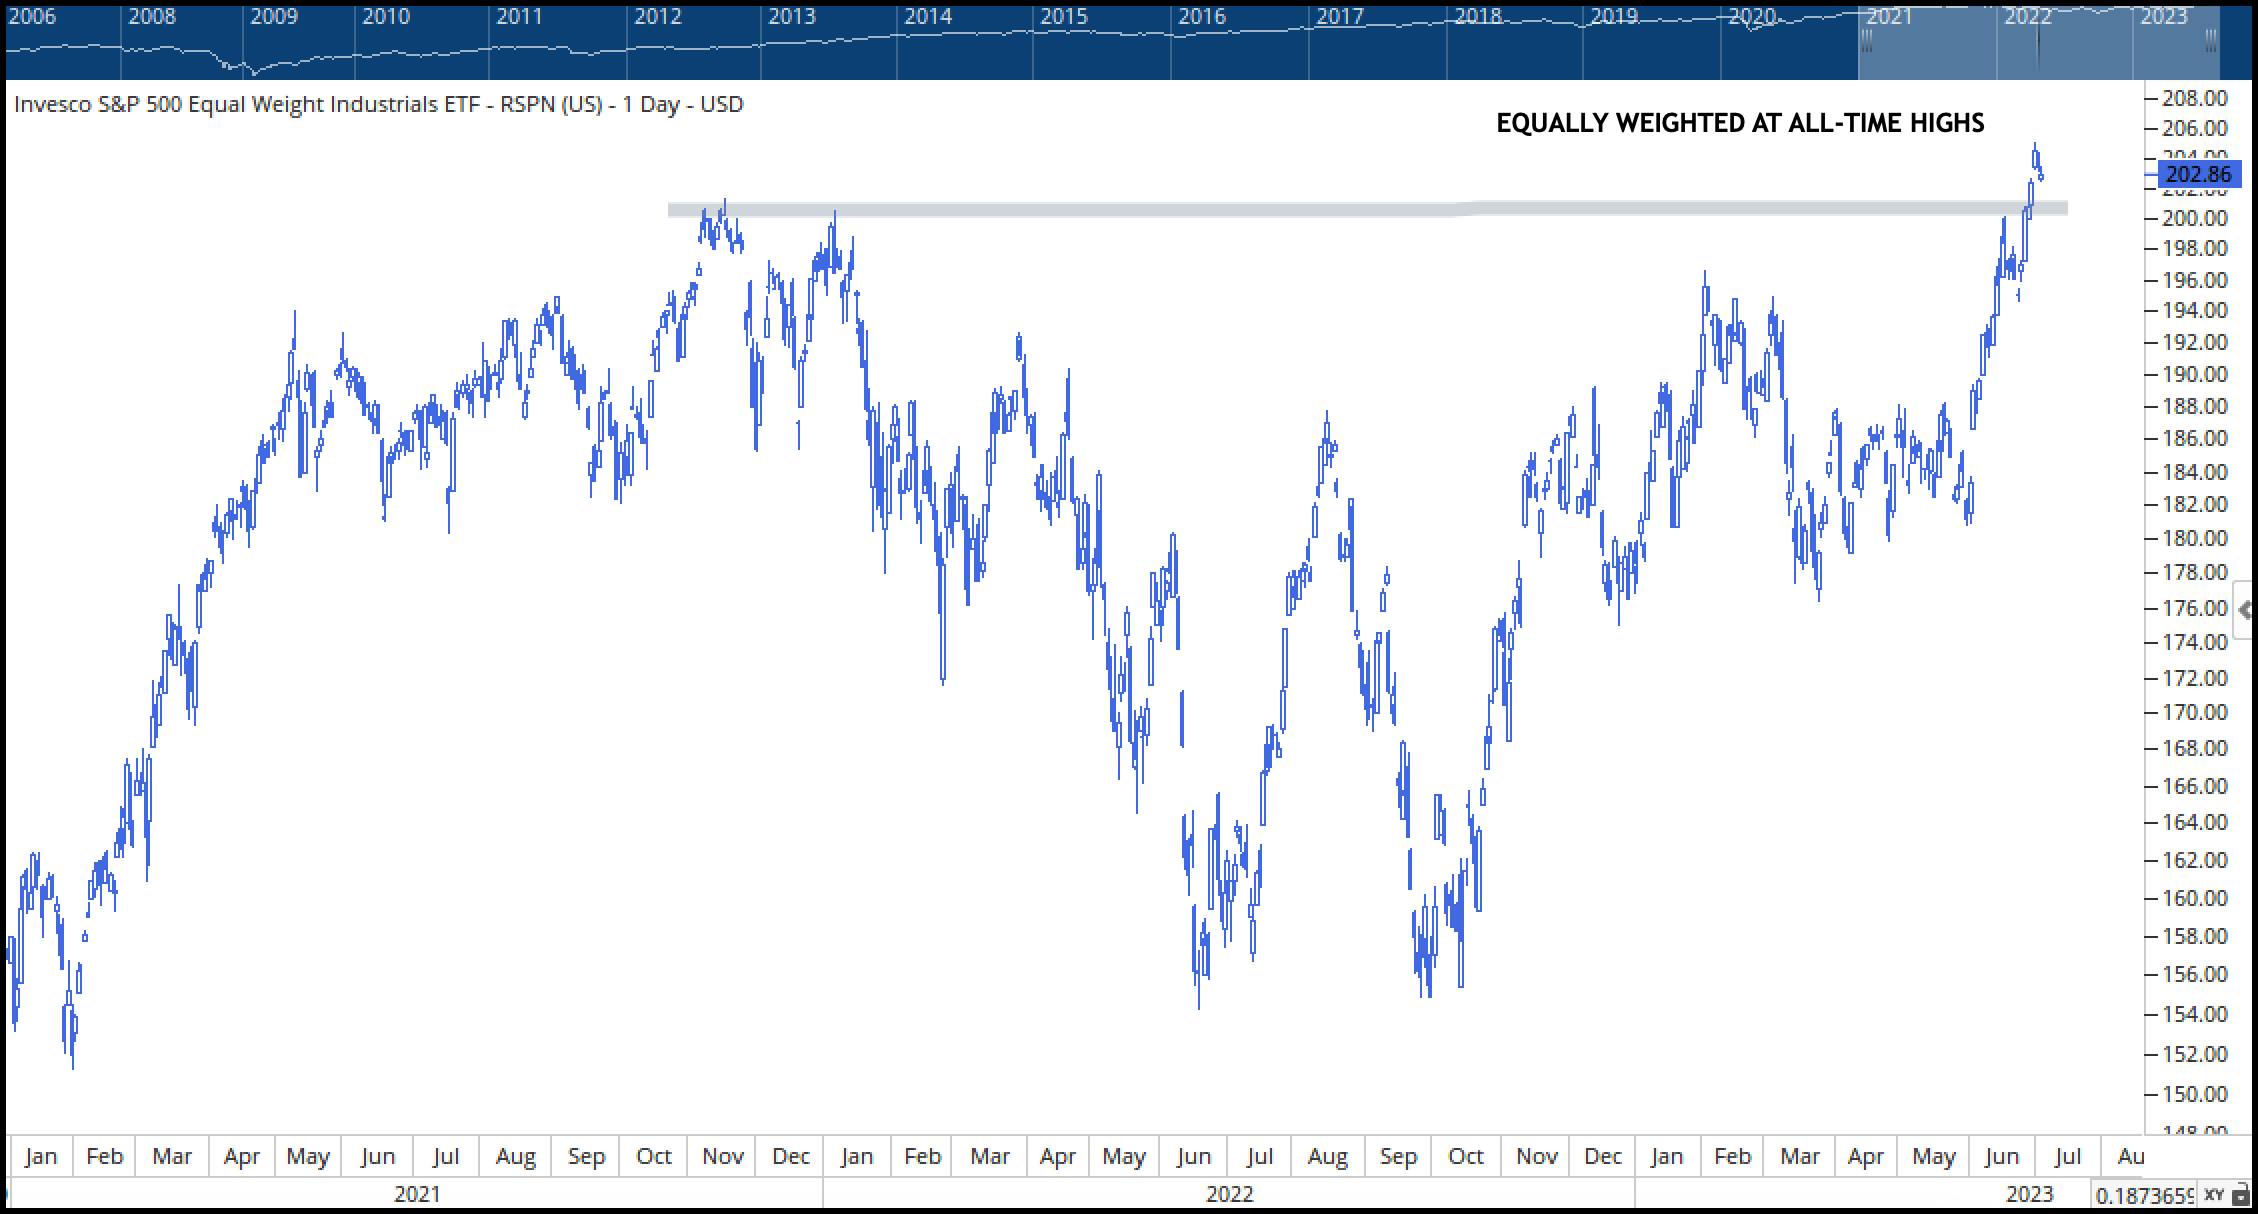
And here’s the equally weighted Industrial sector fund RSPN. It recently broke to new all-time highs. Nothing bearish about that.
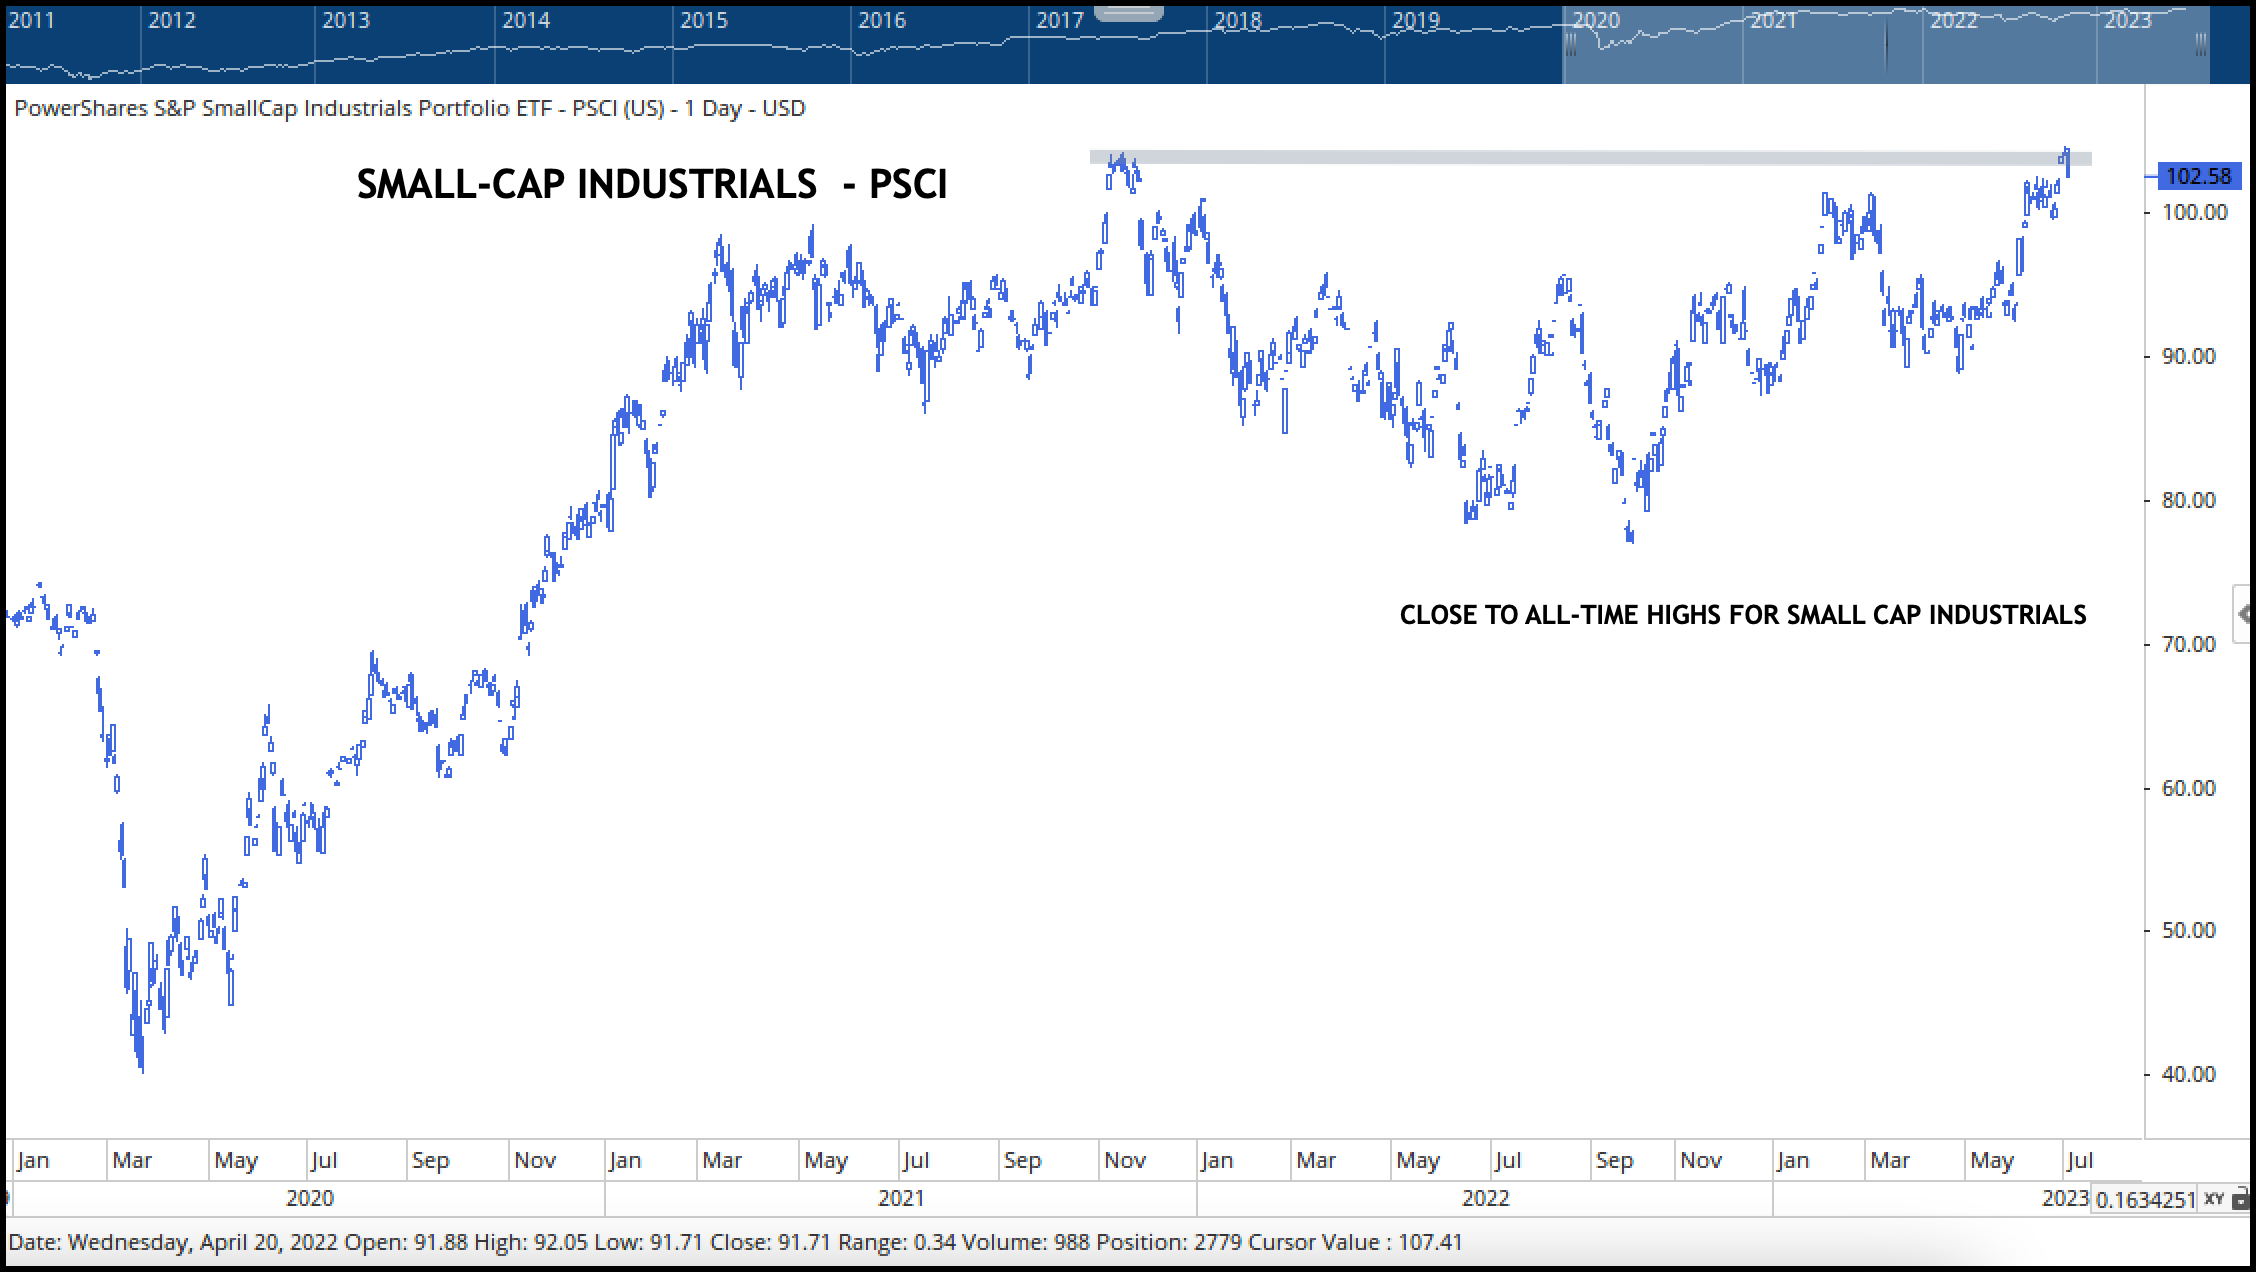
Next up is the Small-Cap Industrial ETF (PSCI) bumping up against all-time highs, it can’t be said it’s only large-cap stocks participating in the market’s recent move.
And here are two Transportation ETFs: the iShares U.S. Transportation Sector ETF (IYT) and the SPDR S&P Transportation ETF (XTN).
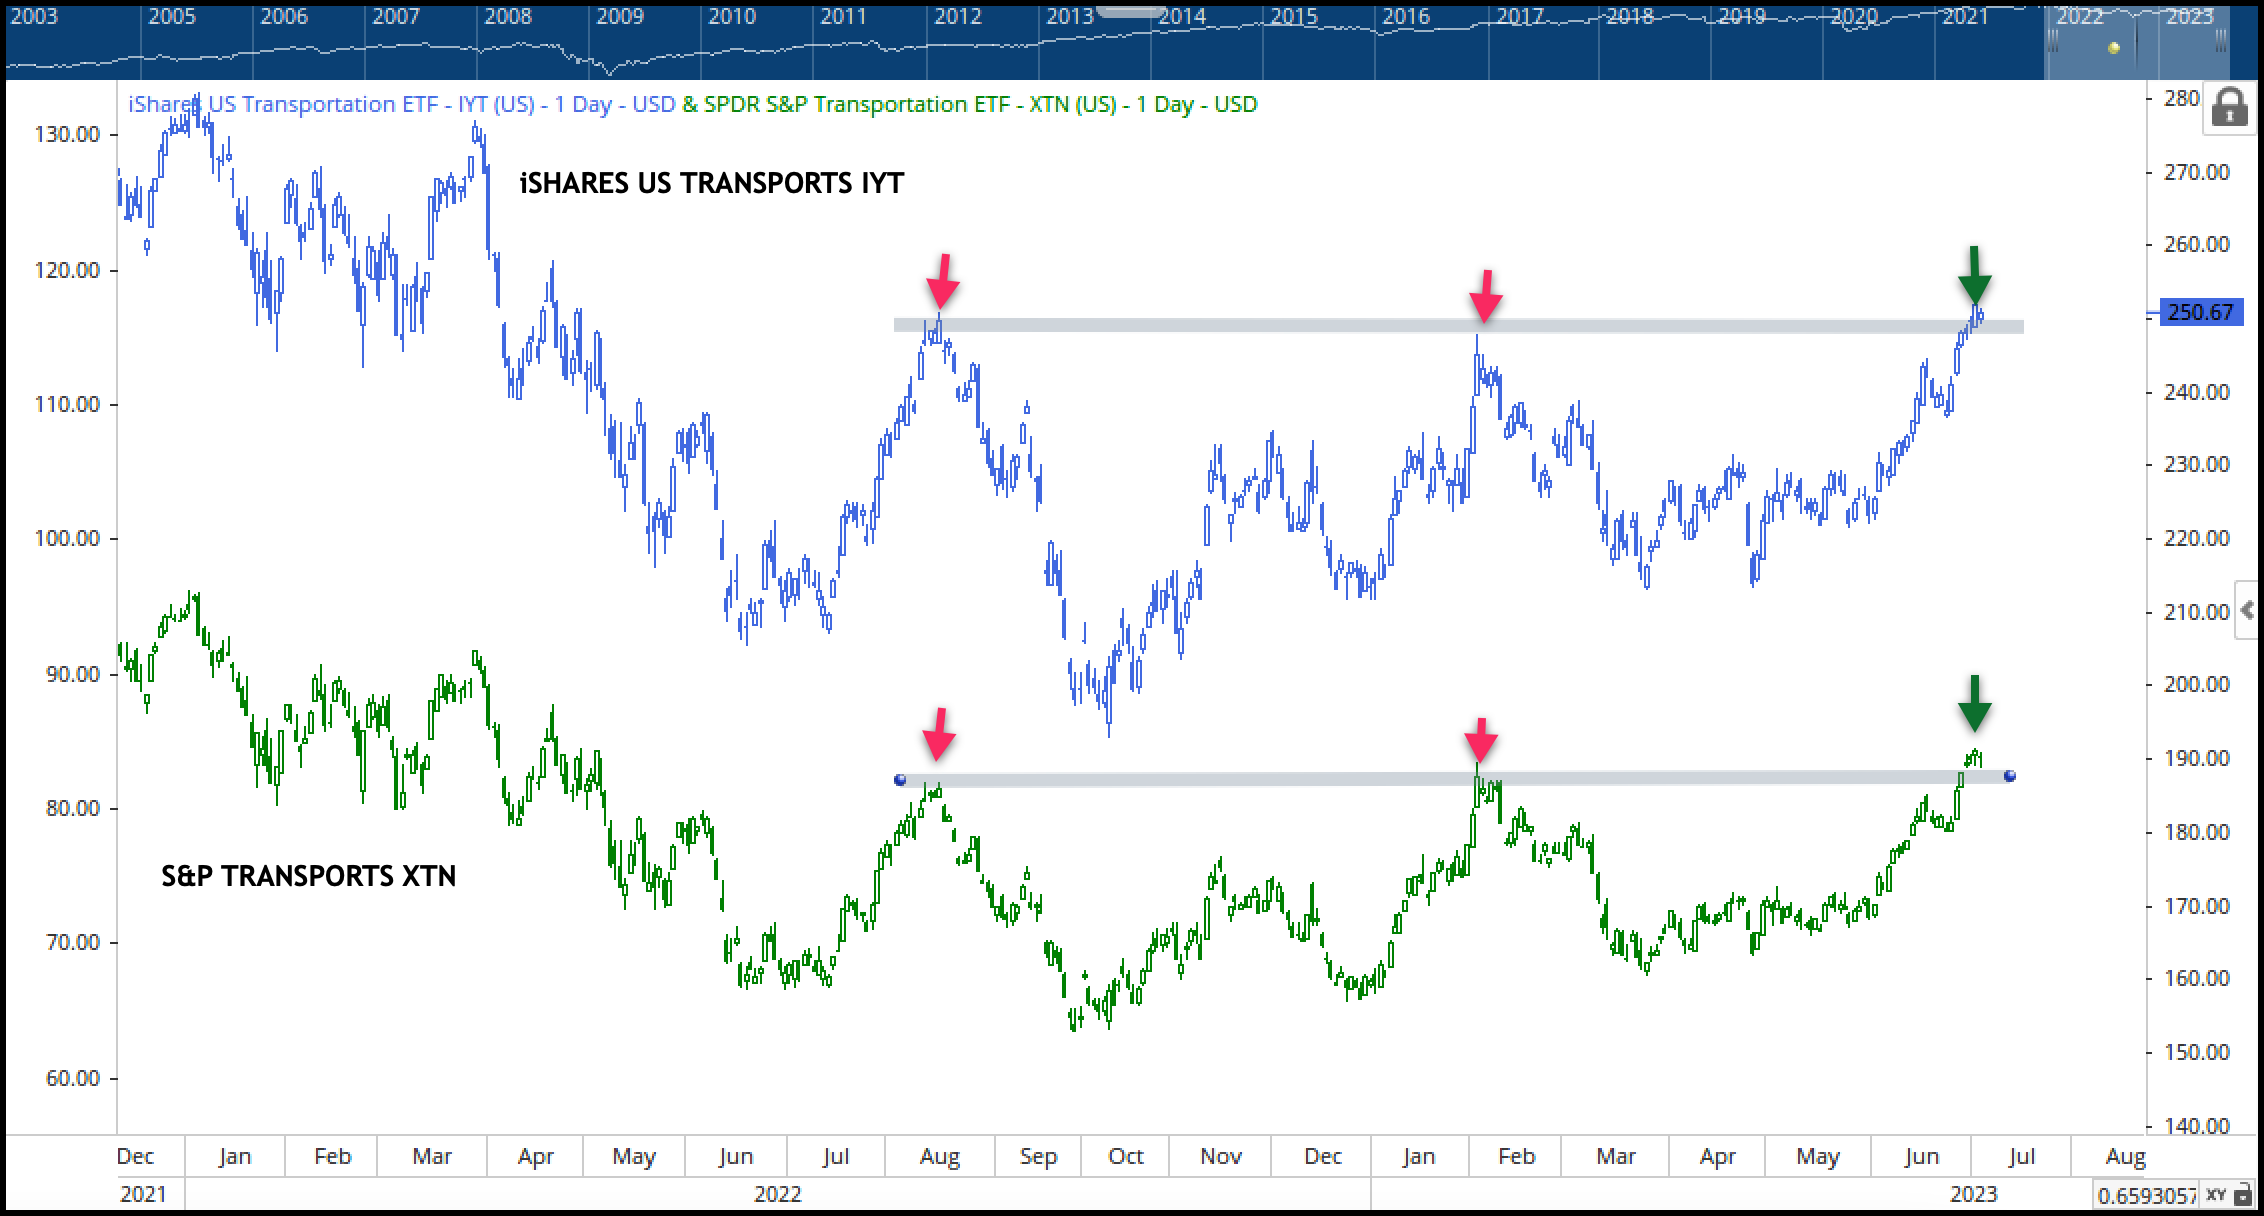
Both are breaking through areas of previous resistance as transportation stocks continue to show strength.
These are two we’ll want to continue to watch for not only for ongoing strength in transportation-related stocks but as confirmation of Industrial output.
There you have it…
A classic Dow confirmation and buy signal, indicating the primary trend is up and there is an opportunity for stock ownership.
I’m sure plenty of you reading this will be asking “How can this be? We have inverted yield curves, interest rates at the highest levels in decades, and a Fed implying more rate increases to come, with headlines promising recession.”
Many of the fundamentals of the U.S. economy look shaky, but we trade and invest based on price. And since the October 2022 lows, stock prices have moved higher.
Remove the emotion and the headlines.
You’re better off combining the guidelines set forth for trend identification with the theorem on confirmation first used by Charles Dow over 100 years ago.
Lucky for us, it still has valid application in 2023.
Schedule an appointment today with me or one of our other experienced advisors who can guide you through the intricacies of the markets every step of the way.
Our team at Avalon understands the importance of client-specific solutions, and we’re committed to helping you achieve your financial goals.
If you have any questions or have been considering hiring an advisor, then schedule a free consultation with one of our advisors today. There’s no risk or obligation—let's just talk.
Tags

Free Guide: How to Find the Best Advisor for You
Get our absolutely free guide that covers different types of advisory services you'll encounter, differences between RIAs and broker-dealers, questions you’ll want to ask when interviewing advisors, and data any good financial advisor should know about you and your portfolio.
