
Related Blogs
November 9, 2018 | Michael Reilly
The results of the midterms have sent many investors into “worry mode” as they brace for a possible political shakeup that could affect their accounts.
But, to quote Warren Buffet: “If you Mix politics and investing, you’re making a big mistake.”
This echoes something we’ve said time and time again here in ADAPT. As an investor, if you let stress and emotion enter your investment strategy, you’re setting yourself up for possible failure.
Instead, we always advise you look at the market data (which isn’t subject to emotions) and then draw conclusions from what you see going on inside of the market.
What’s Happened After Midterms in the Past
A lot of the market fear currently building up has to do with the strong performance we’ve seen over the past few years. There’s been a 28% rise in the market since Trump has taken office and some investors worry that Democrat control of the house could signal a change is coming.
However, if you’re among those questioning the future, you’d be wise to remember one simple fact.
Since 1946, 100% of midterm elections have seen the market up within twelve months.
That’s right. 72 years, covering every single possible combination of political party control, and the market has risen every single time.
On average, the market rises 17% over the 12 months following midterm elections. In fact, if you measure from yearly midterm lows, the market rises an average of 32% in the same time frame. The period between midterm elections and the next presidential election is traditionally the strongest for the market.
Of course, there’s always the chance that this time will be different…but historically there’s not really any evidence to suggest this will be the case.
Let’s look at what price is telling us about the mood of the markets today. To do that, we’ll look at the NYSE BPI. As bored as you might all get by our often referenced indicator, it remains a good gauge of market participation.
Today- we can see demand reasserting itself as the NYSE BPI is once again back in X’s. See the new column of X’s on the far right of the chart below?
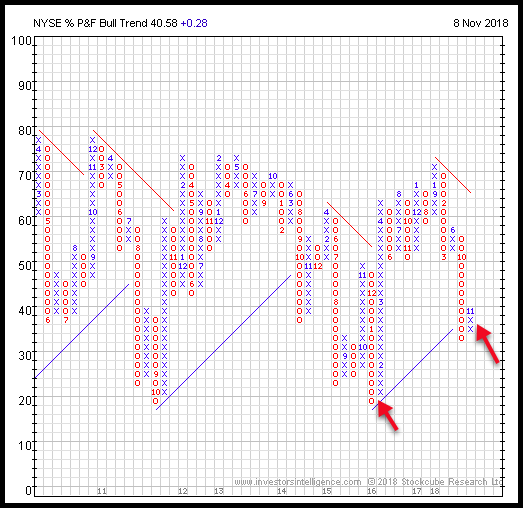
This is a welcome sign for technical investors like ourselves. This indicator, with its X’s and O’s, tells us which team is on the field of play, offense or defense. And as of November 8, 2108, the offensive team is back on the field. The move to offense means we’ll be looking at stocks in the strongest sectors…at what may be bargain prices.
In the past, reversals from O’s to X’s while at such low levels have been buying opportunities for investors who followed their investment rules, rather than allowing emotion to rule the day.
Referring back to the chart above, the first red arrow on the chart indicates the last time the market got this washed out in 2016. It scared off a lot of investors.
But look at the rise in the S&P 500 from the February low to the beginning of the new year (2017). The S&P 500 rose 18.23% between February 2 and year end 2016.
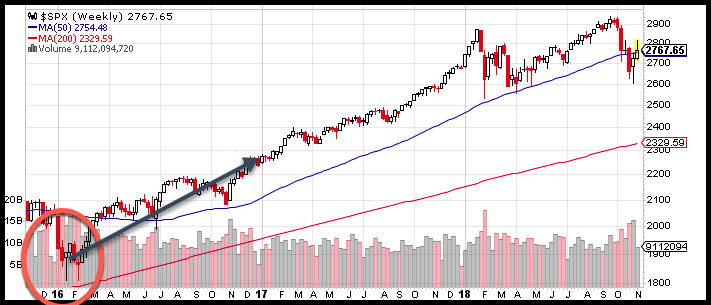
Looking out even further off the February 2016 lows, the S&P 500 Index returned 40.85% and the DOW rewarded investors with a 53.9% gain through December 2017 (data taken from stockcharts).
You see, it pays to follow technical indicators such as the NYSE BPI.
It’s early to know if we’ll retest the recent lows once again or if the worst is behind us. But when we add up the weight of the evidence, I like what I see.
- U.S. Equities remain the strongest asset class in which to invest.
- Markets are coming out of seriously washed out levels – not often seen.
- Cyclically, we are entering what is considered the “best six months of the market” (November thru April).
- And we’ll soon begin the pre-election year (2019), which is historically the best performing year of a presidency.
As you already know, you can never make guarantees when it comes to the market, but all these positive factors coming together make a good case for strong performance over the next year.
This is an important time to make sure your accounts are primed to take advantage of “the best six months of the market” and the coming pre-election year.
In our opinion, one of the best ways to prepare is to make sure your accounts have exposure to the sectors and sub-sectors with the highest relative strength.
If you’re not sure just how “strong” your holdings are, make sure to schedule a call with one of the advisors at Rowe Wealth.
Even if you’re not already one of our clients, you can still receive a free portfolio evaluation and risk assessment as long as you have a portfolio containing at least $500,000 worth of investable inventory.
Click here to see available call times now.

Get Our FREE Guide
How to Find the Best Advisor for You
Learn how to choose an advisor that has your best interests in mind. You'll also be subscribed to ADAPT, Avalon’s free newsletter with updates on our strongest performing investment models and market insights from a responsible money management perspective.
